South Carolina County Map
All 46 counties with county seats and major cities
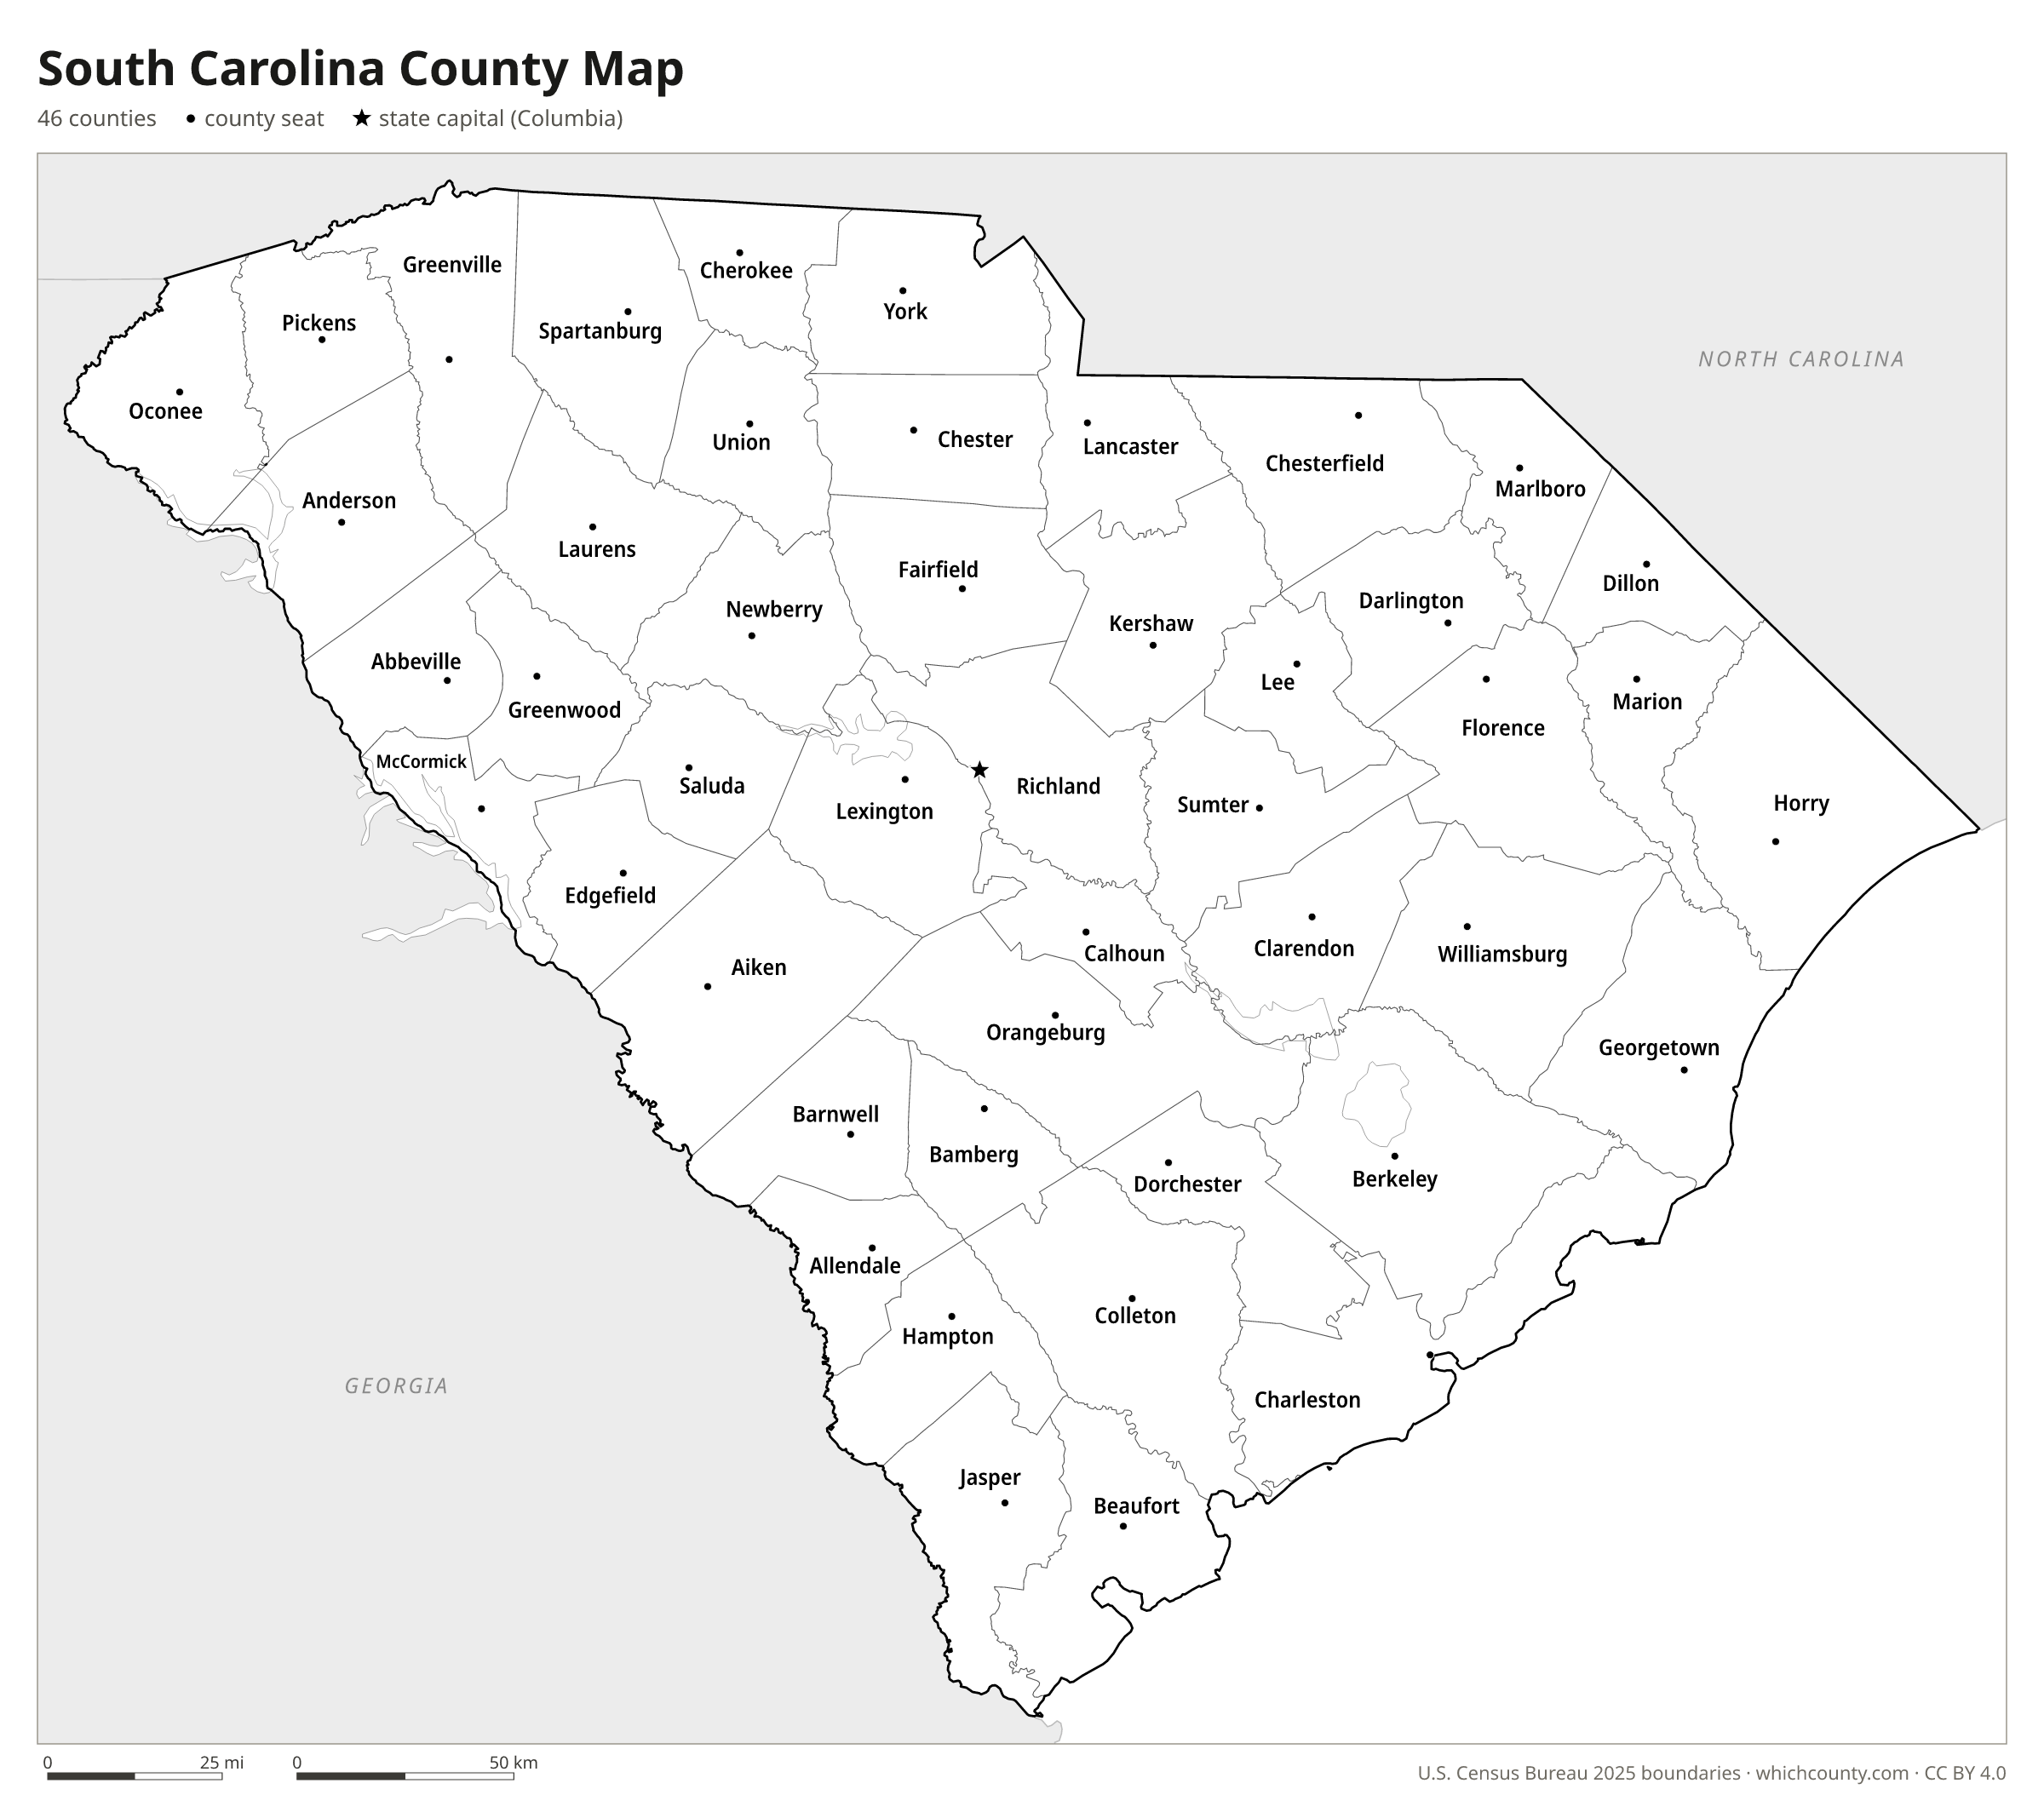
South Carolina has 46 counties, fewer than a third of neighboring Georgia's 159. This map shows all 46 counties and their county seats. Tap a county for details, or download the free printable map below.

Updated October 4, 2026 · Boundaries: U.S. Census Bureau 2025 · Population: Census estimates for July 1, 2025
South Carolina county facts
- Number of counties
- 46
- Largest by land area
- Horry County 1,133 sq mi
- Smallest by land area
- McCormick County 358.9 sq mi
- Most people
- Greenville County 583,125
- Fewest people
- Allendale County 7,355
- Fastest growing since 2020
- Jasper County +33.7%
- Highest median household income
- York County $89,095
- Oldest county
- Charleston County est. 1769
- Newest county
- Allendale County est. 1919
- State capital
- Columbia Richland County
From about 1800 until 1868 the state's main divisions were called districts, not counties; before the Civil War, for example, the Allendale area was the southern third of Barnwell District.
In 1890 the General Assembly repealed the constitutional provisions on counties; the 1895 constitution re-created them.
Until the Local Government Act of 1975, each county's legislative delegation in the General Assembly was in practice its governing body.
List of 46 South Carolina counties
Sorted A–Z. Click a column to sort, or a name to show it on the map. Download as CSV
| County | County seat | Population 2025 | Change since 2020 | Land area (sq mi) | Median income | Established | FIPS |
|---|---|---|---|---|---|---|---|
| Abbeville County | Abbeville | 24,836 | +2.2% | 491 | $52,935 | 1785 | 45001 |
| Aiken County | Aiken | 181,515 | +7.5% | 1,071 | $70,609 | 1871 | 45003 |
| Allendale County | Allendale | 7,355 | −8.5% | 408 | $32,328 | 1919 | 45005 |
| Anderson County | Anderson | 219,930 | +8% | 714 | $66,651 | 1826 | 45007 |
| Bamberg County | Bamberg | 12,796 | −3.9% | 393 | $44,370 | 1897 | 45009 |
| Barnwell County | Barnwell | 20,653 | +0.3% | 548 | $46,626 | – | 45011 |
| Beaufort County | Beaufort | 204,433 | +9.3% | 576 | $86,573 | – | 45013 |
| Berkeley County | Moncks Corner | 274,666 | +19.5% | 1,104 | $84,358 | 1882 | 45015 |
| Calhoun County | St. Matthews | 14,188 | +0.5% | 381 | $58,682 | 1908 | 45017 |
| Charleston County | Charleston | 436,200 | +6.8% | 918 | $88,494 | 1769 | 45019 |
| Cherokee County | Gaffney | 58,275 | +3.7% | 393 | $50,288 | 1897 | 45021 |
| Chester County | Chester | 33,001 | +2.2% | 581 | $52,458 | 1785 | 45023 |
| Chesterfield County | Chesterfield | 44,740 | +3.4% | 799 | $49,235 | 1798 | 45025 |
| Clarendon County | Manning | 31,043 | −0.3% | 607 | $52,401 | 1855 | 45027 |
| Colleton County | Walterboro | 39,382 | +2% | 1,057 | $51,114 | 1800 | 45029 |
| Darlington County | Darlington | 62,888 | −0% | 561 | $48,581 | 1785 | 45031 |
| Dillon County | Dillon | 27,458 | −3% | 405 | $46,605 | 1910 | 45033 |
| Dorchester County | St. George | 178,397 | +10.6% | 568 | $78,198 | 1897 | 45035 |
| Edgefield County | Edgefield | 29,808 | +16.2% | 501 | $73,029 | 1785 | 45037 |
| Fairfield County | Winnsboro | 20,340 | −3% | 686 | $47,885 | 1785 | 45039 |
| Florence County | Florence | 138,504 | +1.1% | 801 | $58,305 | 1888 | 45041 |
| Georgetown County | Georgetown | 65,912 | +4% | 814 | $68,713 | 1769 | 45043 |
| Greenville County | Greenville | 583,125 | +11% | 786 | $76,932 | 1786 | 45045 |
| Greenwood County | Greenwood | 70,379 | +1.5% | 456 | $52,830 | 1897 | 45047 |
| Hampton County | Hampton | 18,174 | −2.1% | 560 | $44,711 | 1878 | 45049 |
| Horry County | Conway | 427,551 | +21.8% | 1,133 | $66,880 | 1801 | 45051 |
| Jasper County | Ridgeland | 38,533 | +33.7% | 655 | $65,613 | 1912 | 45053 |
| Kershaw County | Camden | 73,166 | +11.9% | 727 | $68,231 | 1791 | 45055 |
| Lancaster County | Lancaster | 114,296 | +19% | 549 | $78,869 | 1798 | 45057 |
| Laurens County | Laurens | 71,848 | +6.4% | 713 | $57,623 | 1785 | 45059 |
| Lee County | Bishopville | 15,730 | −4.9% | 410 | $44,760 | 1902 | 45061 |
| Lexington County | Lexington | 317,588 | +8.1% | 699 | $77,408 | 1804 | 45063 |
| Marion County | Marion | 28,242 | −3.2% | 489 | $36,301 | 1800 | 45067 |
| Marlboro County | Bennettsville | 25,488 | −4.4% | 480 | $34,301 | 1785 | 45069 |
| McCormick County | McCormick | 10,215 | +7.2% | 359 | $55,798 | 1914 | 45065 |
| Newberry County | Newberry | 39,561 | +4.9% | 630 | $61,780 | 1785 | 45071 |
| Oconee County | Walhalla | 83,775 | +6.6% | 627 | $62,388 | 1868 | 45073 |
| Orangeburg County | Orangeburg | 83,177 | −1.3% | 1,106 | $45,675 | 1769 | 45075 |
| Pickens County | Pickens | 139,198 | +5.9% | 497 | $61,064 | 1826 | 45077 |
| Richland County | Columbia | 434,956 | +4.5% | 757 | $63,784 | 1785 | 45079 |
| Saluda County | Saluda | 19,680 | +3.9% | 453 | $51,009 | 1896 | 45081 |
| Spartanburg County | Spartanburg | 380,857 | +16.1% | 808 | $66,234 | 1785 | 45083 |
| Sumter County | Sumter | 105,067 | −0.5% | 665 | $56,693 | – | 45085 |
| Union County | Union | 26,799 | −1.6% | 514 | $41,621 | 1798 | 45087 |
| Williamsburg County | Kingstree | 29,662 | −4.4% | 934 | $46,213 | 1804 | 45089 |
| York County | York | 306,887 | +8.9% | 681 | $89,095 | 1798 | 45091 |
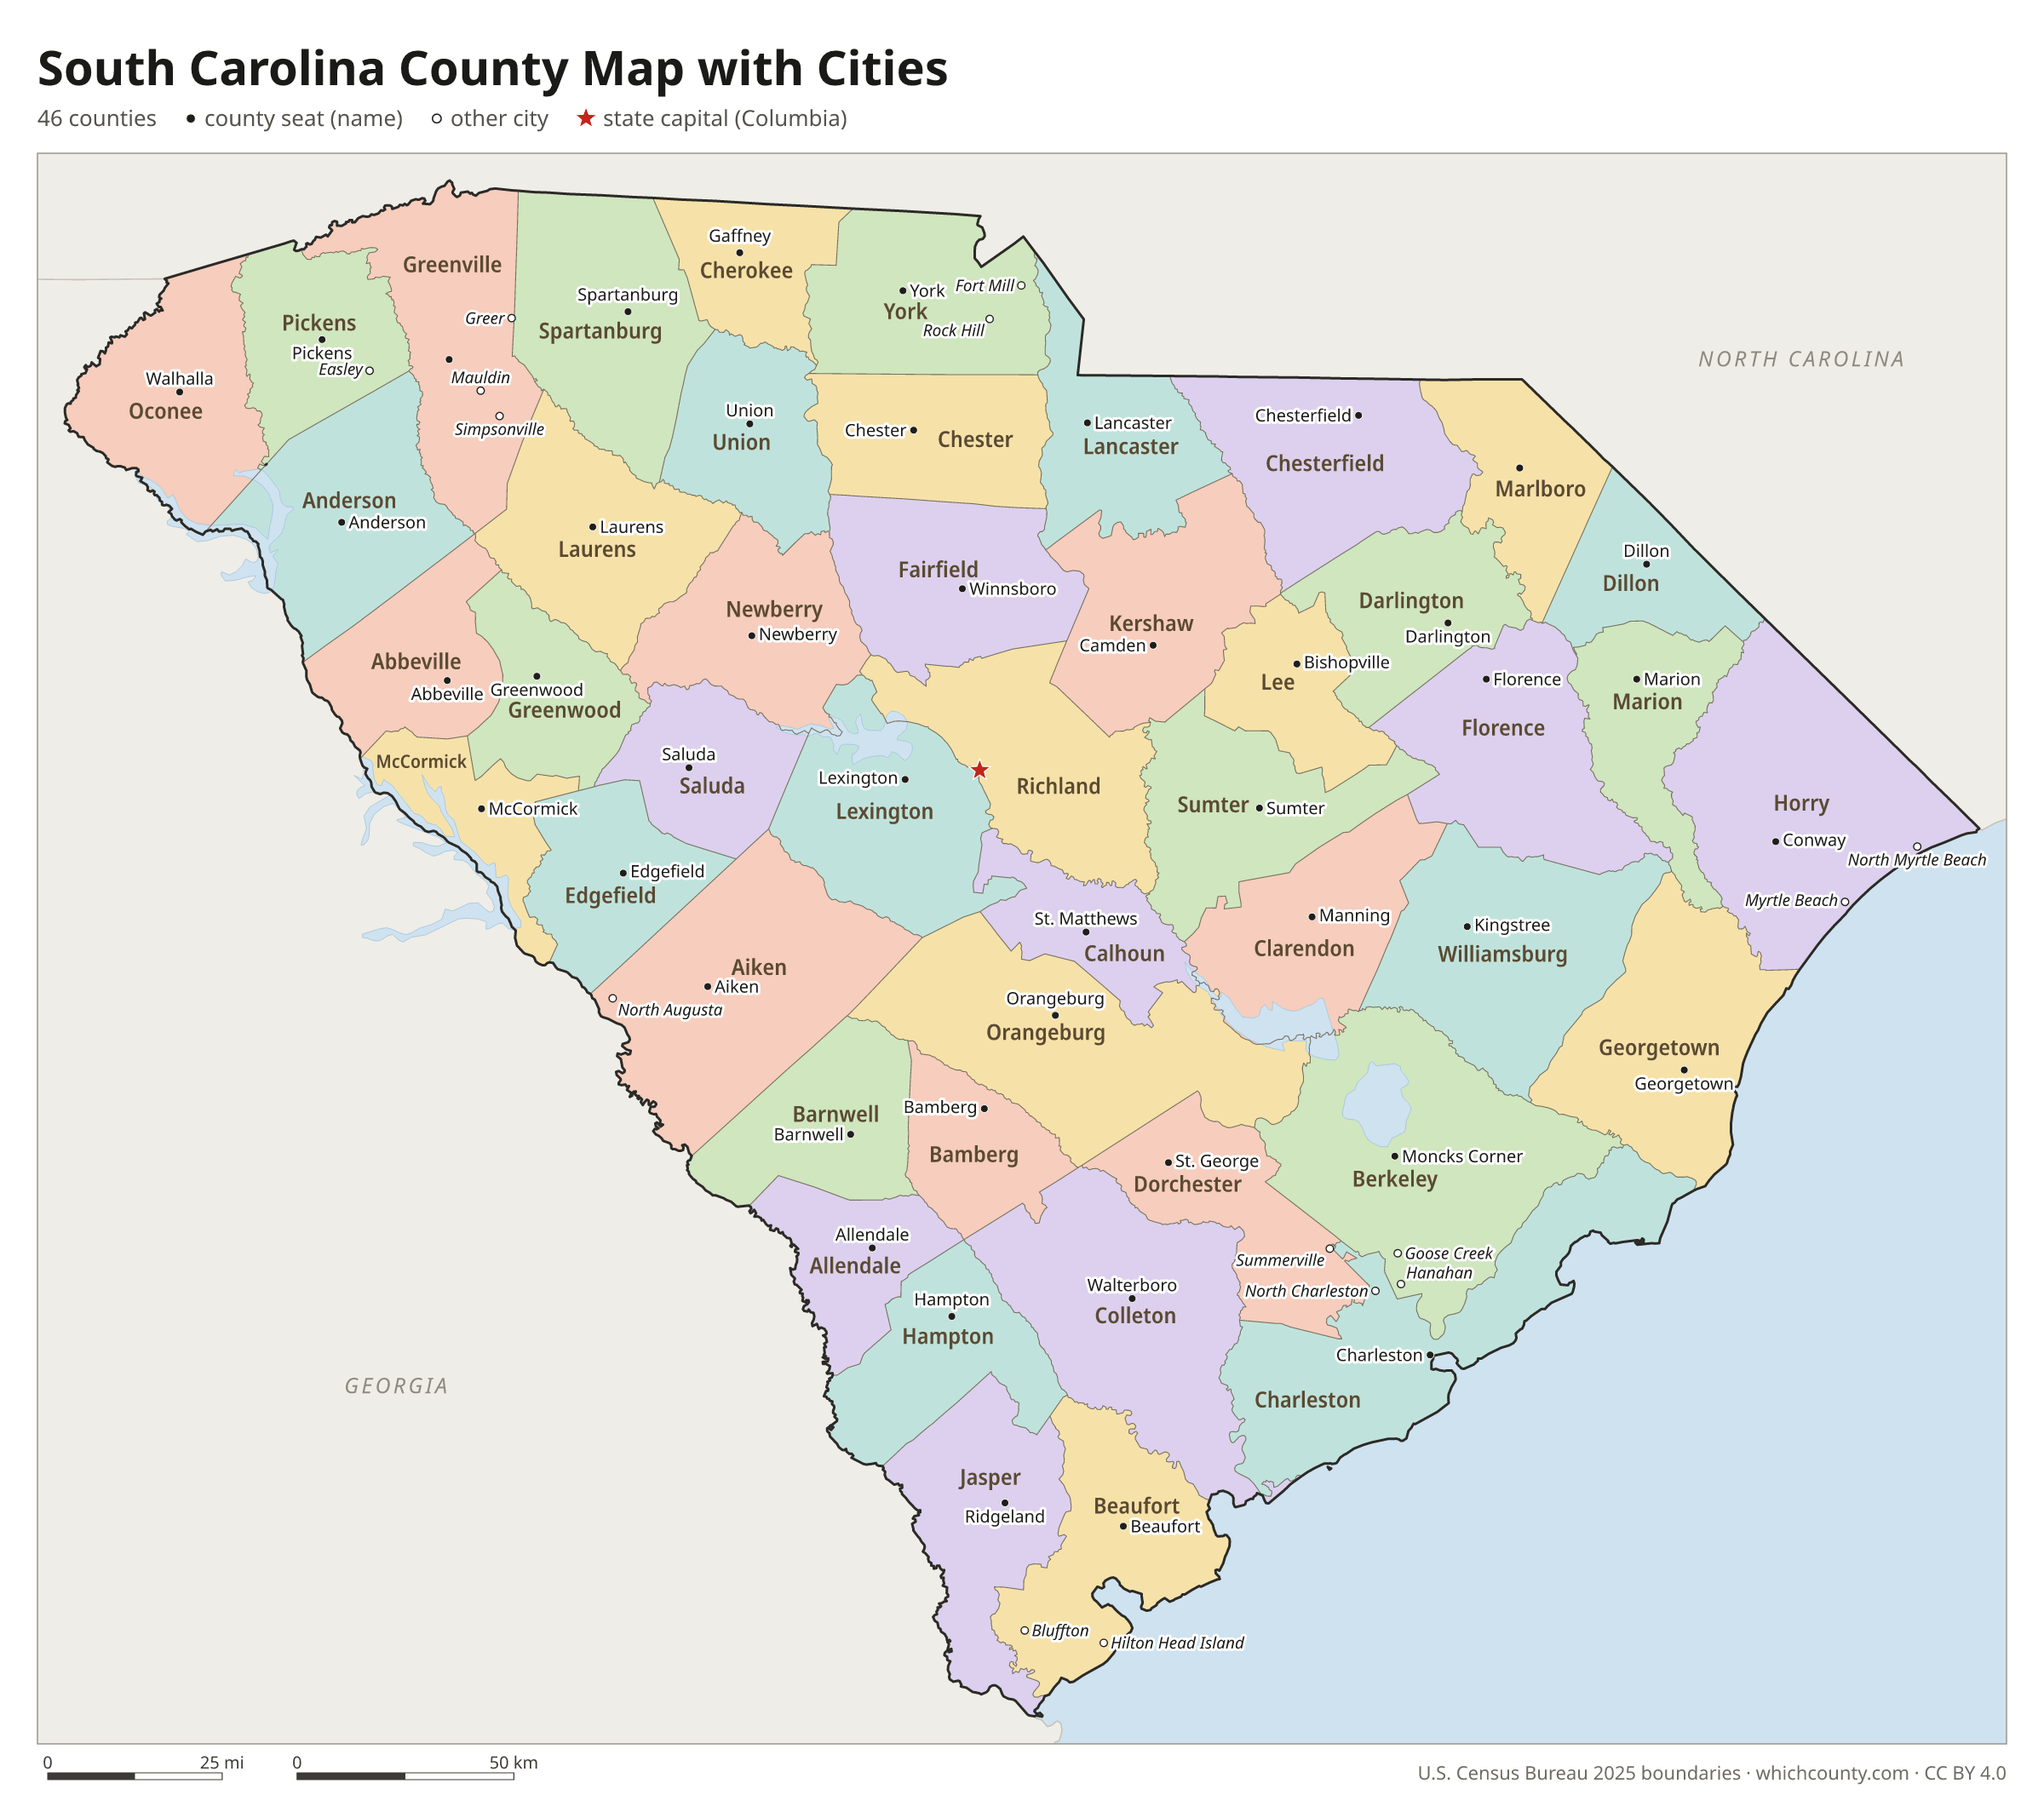
South Carolina county map with cities
The largest cities in South Carolina and the counties they are in. Cities that cross a county line list every county, the main one first. To find any smaller town, use the search box above.
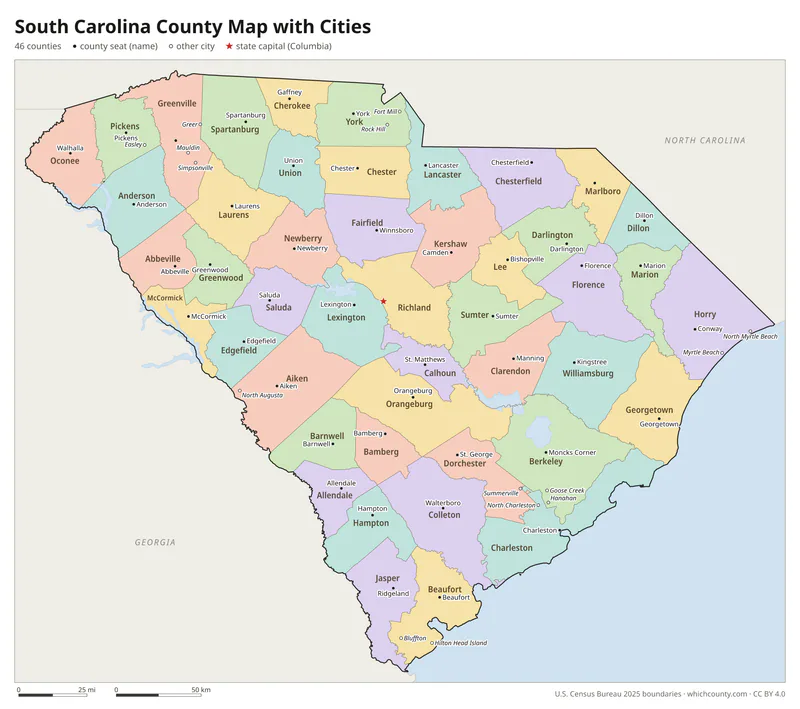
| City | County | Population 2025 |
|---|---|---|
| Charleston | Charleston and Berkeley counties | 159,423 |
| Columbia | Richland, Lexington and Kershaw counties | 147,035 |
| North Charleston | Charleston, Dorchester and Berkeley counties | 129,245 |
| Mount Pleasant | Charleston County | 95,469 |
| Rock Hill | York County | 75,911 |
| Greenville | Greenville County | 75,310 |
| Summerville | Dorchester, Berkeley and Charleston counties | 53,177 |
| Goose Creek | Berkeley County | 52,010 |
| Greer | Greenville and Spartanburg counties | 50,007 |
| Sumter | Sumter County | 43,094 |
| Florence | Florence and Darlington counties | 41,231 |
| Myrtle Beach | Horry County | 40,937 |
| Spartanburg | Spartanburg County | 39,978 |
| Fort Mill | York County | 38,673 |
| Hilton Head Island | Beaufort County | 38,196 |
| Bluffton | Beaufort County | 36,807 |
| Aiken | Aiken County | 33,808 |
| Mauldin | Greenville County | 31,465 |
| Anderson | Anderson County | 31,323 |
| Conway | Horry County | 30,627 |
| Simpsonville | Greenville County | 28,459 |
| Easley | Pickens and Anderson counties | 27,319 |
| North Augusta | Aiken and Edgefield counties | 26,982 |
| Lexington | Lexington County | 25,729 |
| Greenwood | Greenwood County | 22,745 |
| Hanahan | Berkeley County | 22,415 |
| North Myrtle Beach | Horry County | 21,346 |
| Moncks Corner | Berkeley County | 20,612 |
| Clemson | Pickens and Anderson counties | 18,941 |
| West Columbia | Lexington and Richland counties | 18,489 |
Printable South Carolina county maps (free PDF, PNG, SVG)
Every map is free to print and share. The PDFs are vector files with real text, so they stay sharp at any size and you can search them for a county name. Use 11×17 (tabloid) for the most readable labels.
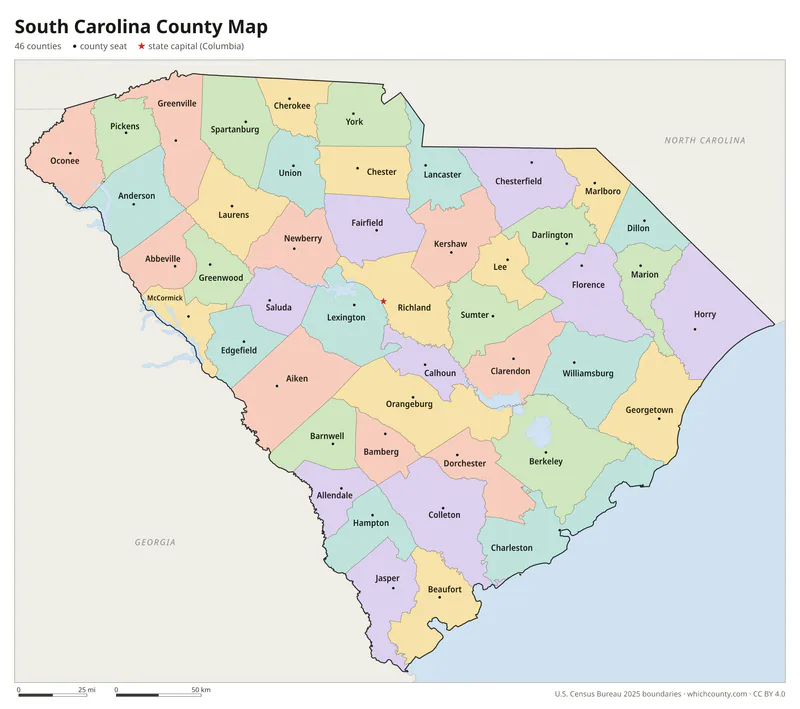
Color map with names
All 46 counties labeled, county seats marked. Letter and 11×17 PDF, high-resolution PNG, editable SVG.
Map with cities
Counties with their county seat towns and major cities.
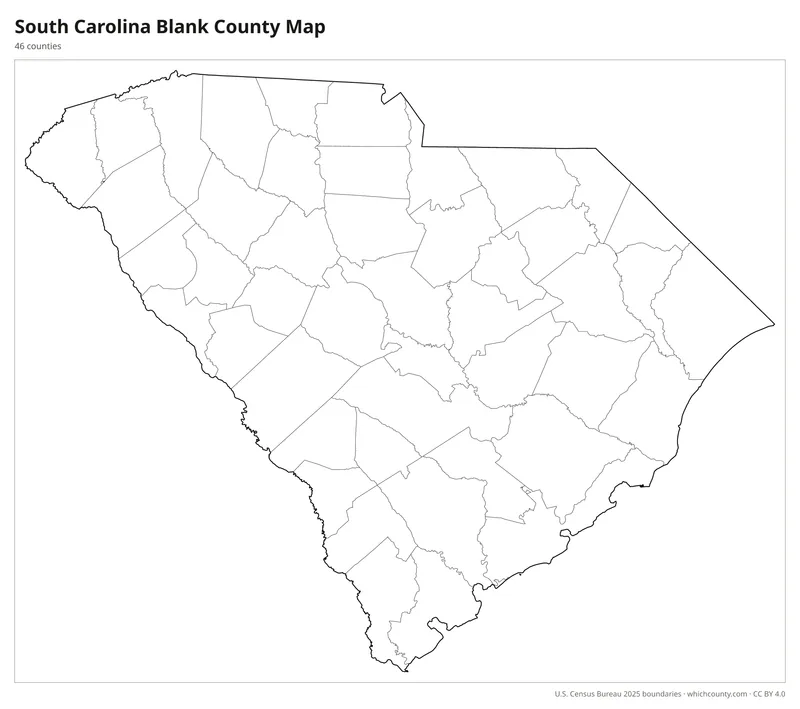
Blank outline map
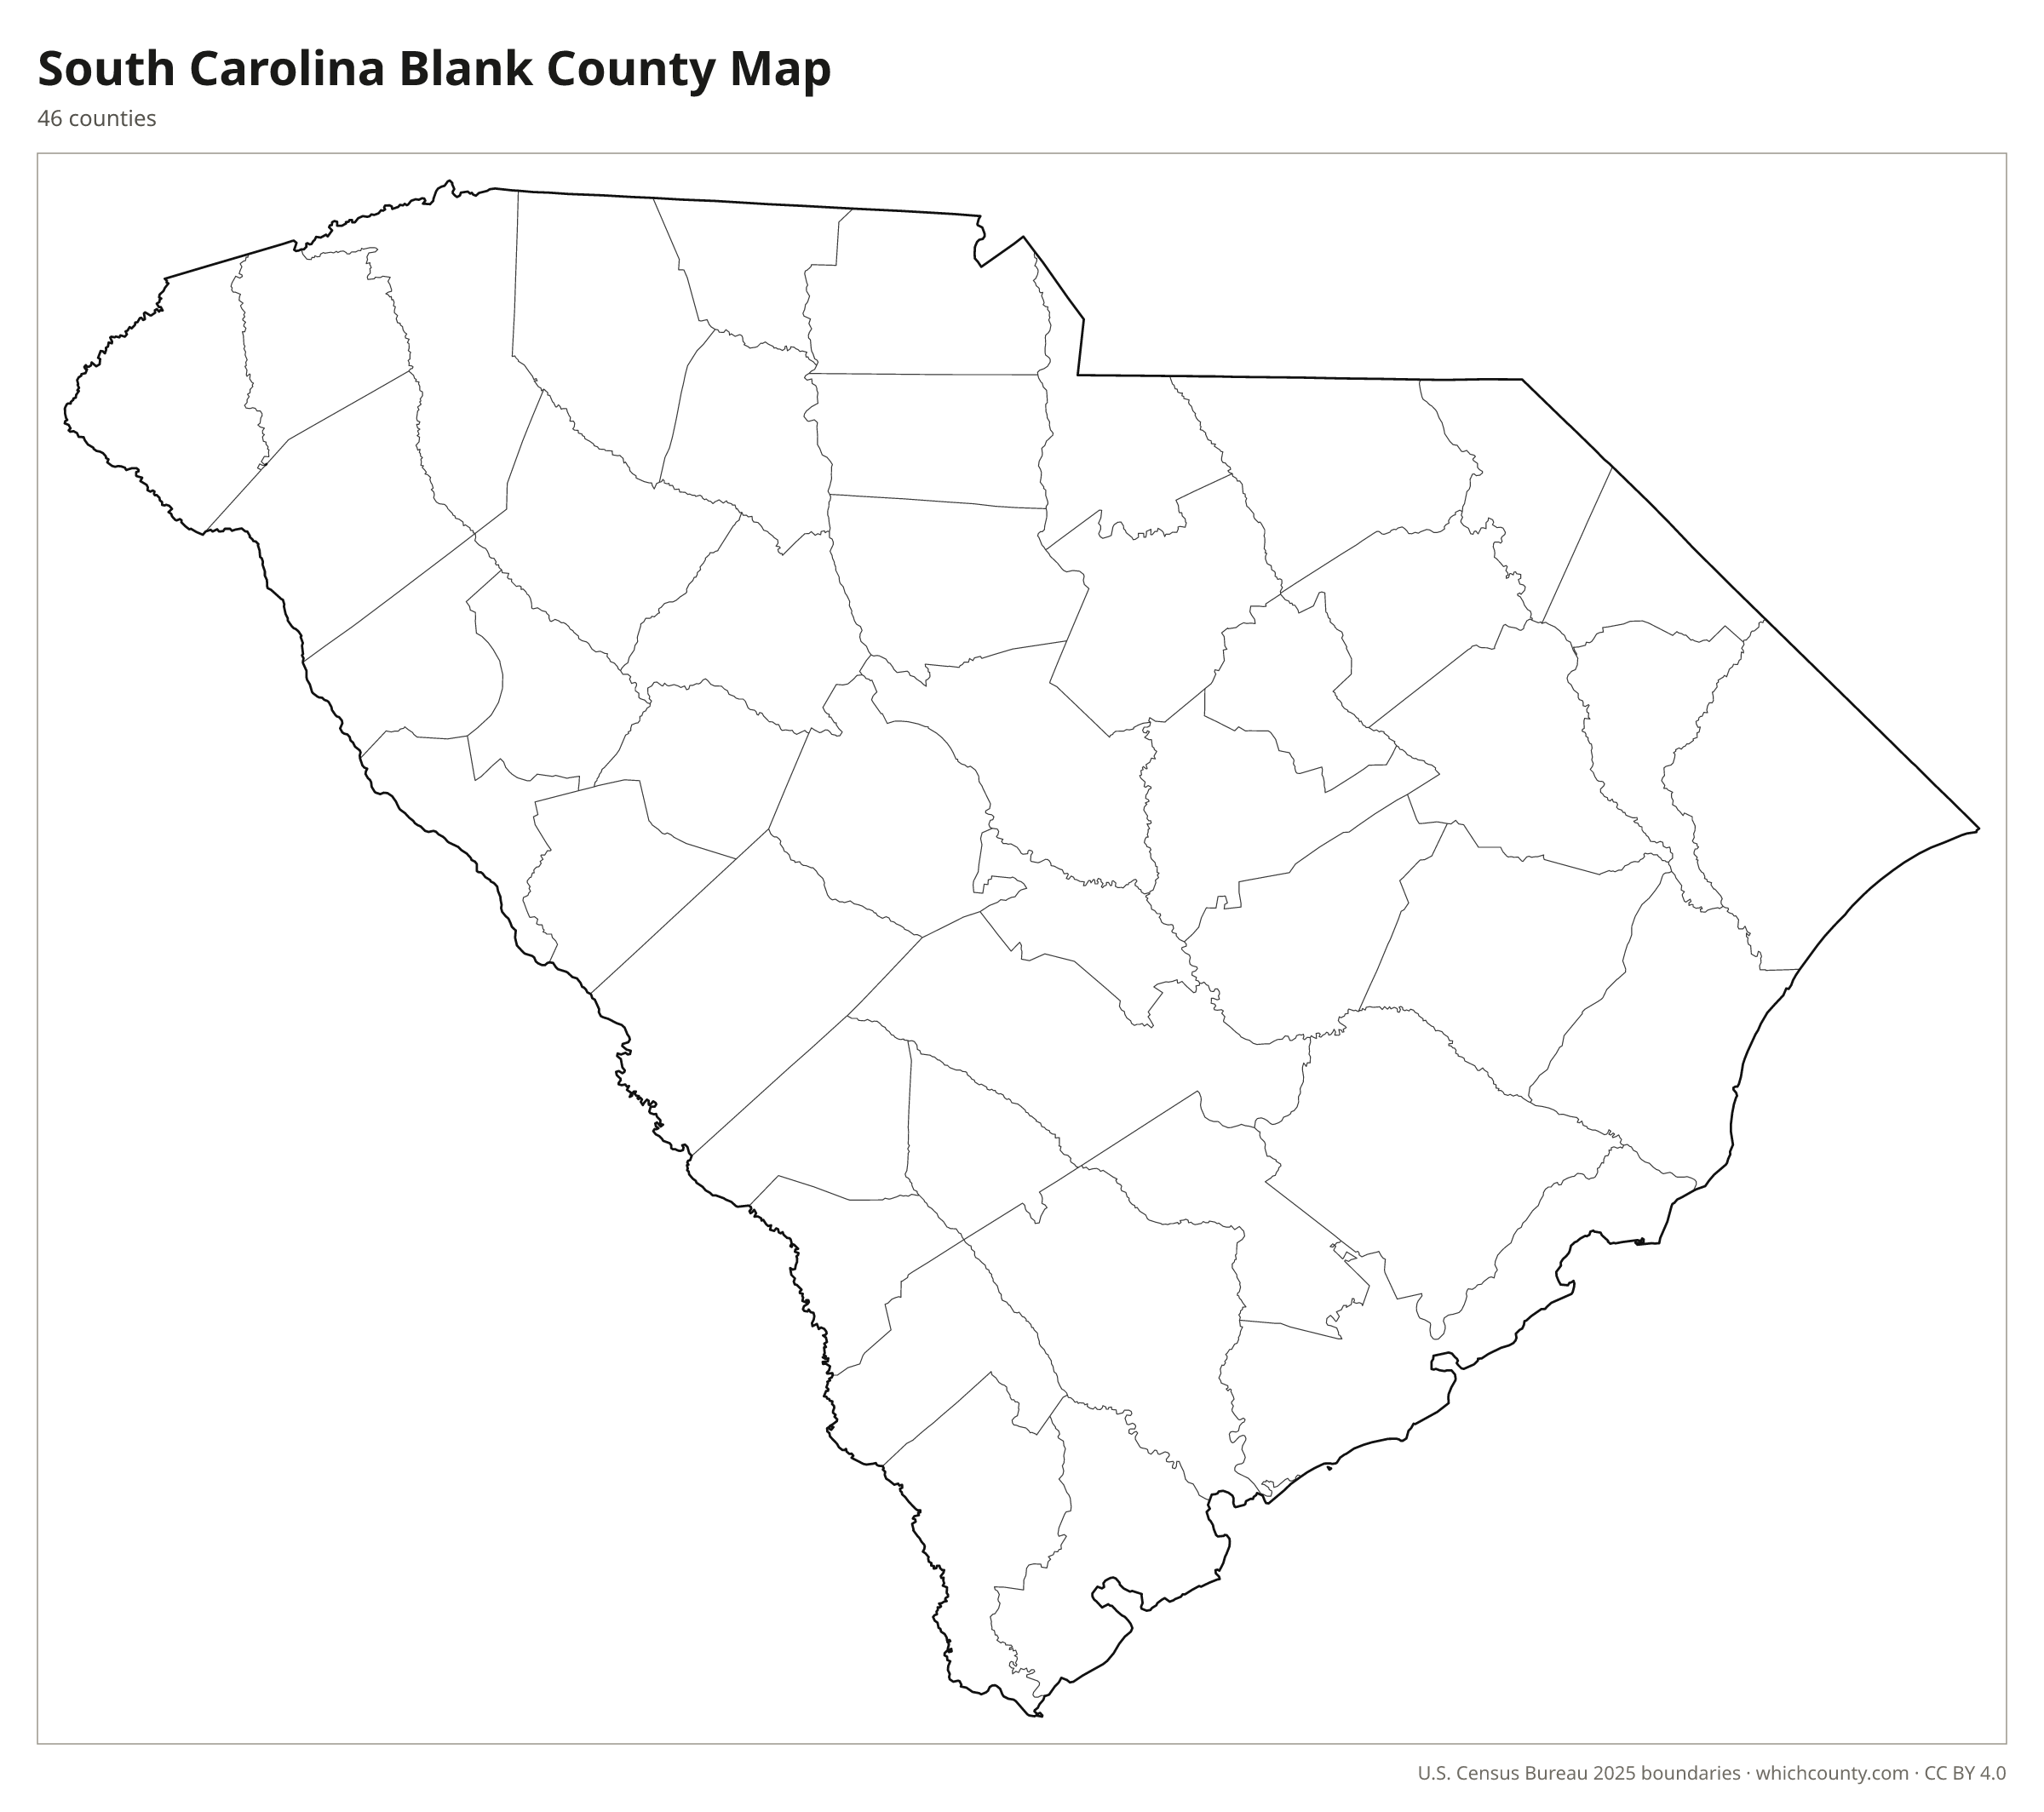
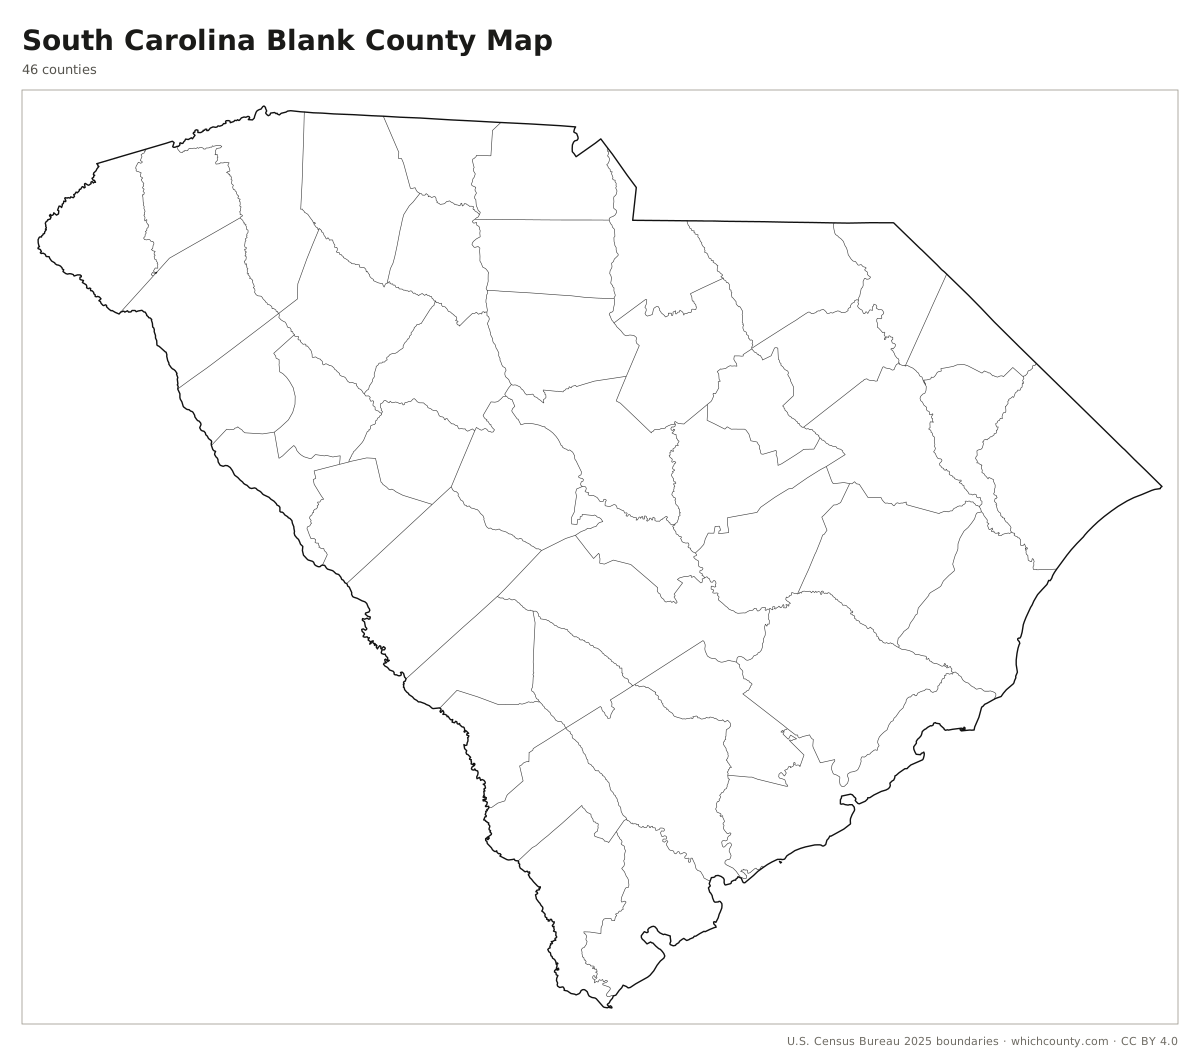
County lines only, no names. For quizzes, coloring and your own notes.
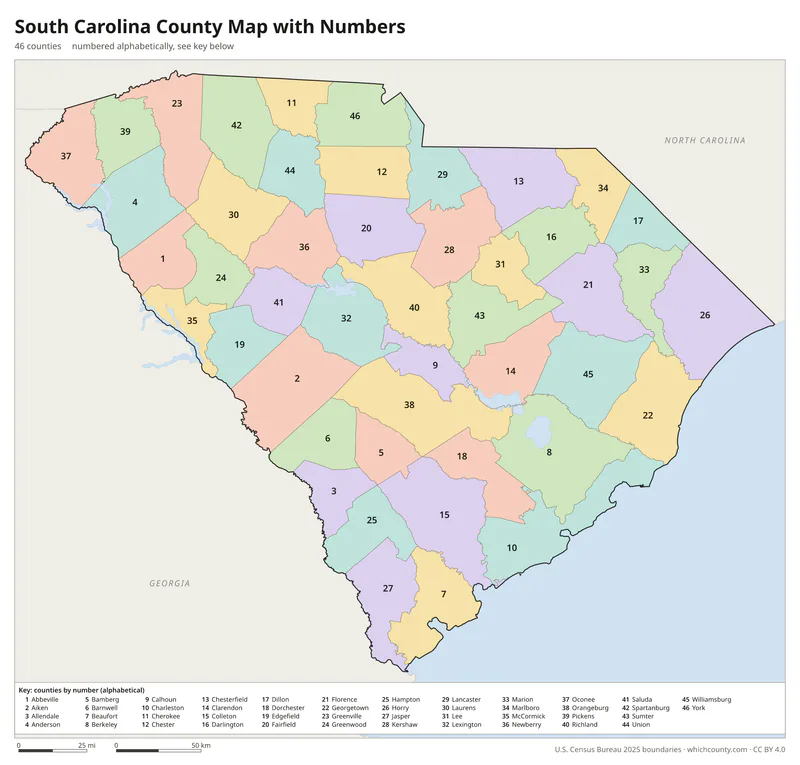
Numbered map with key
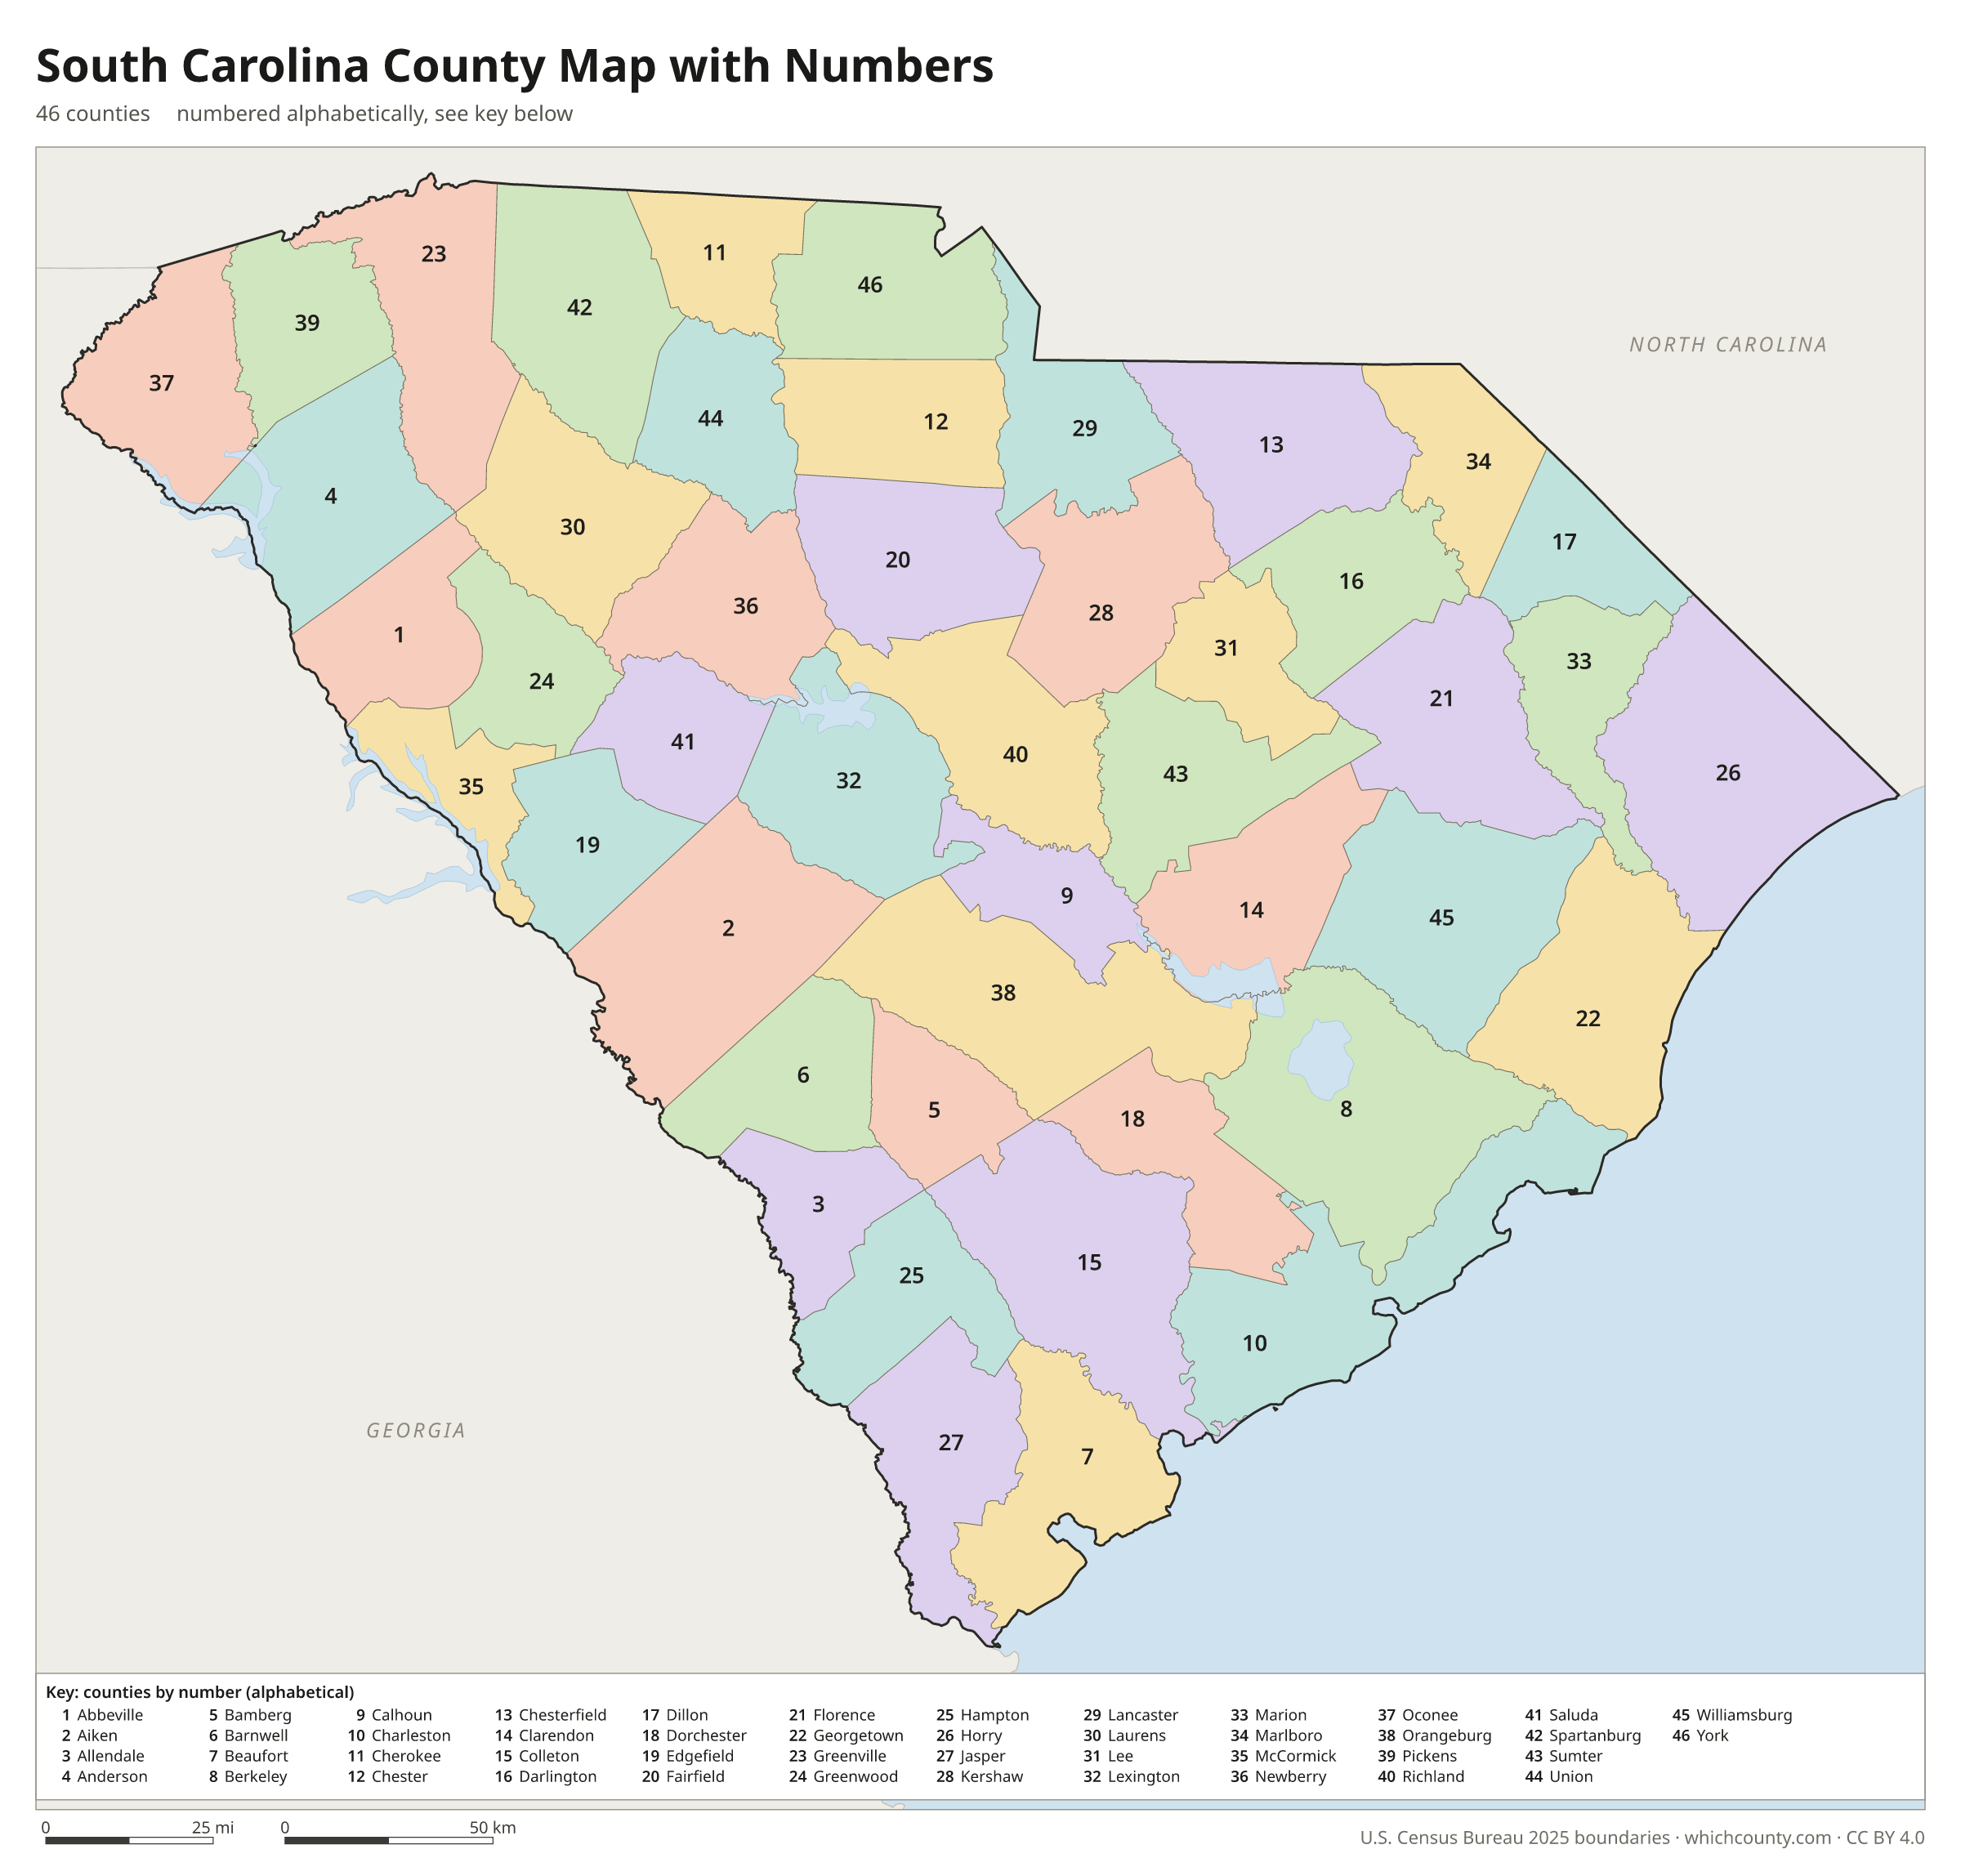
A number in every county with an alphabetical key.
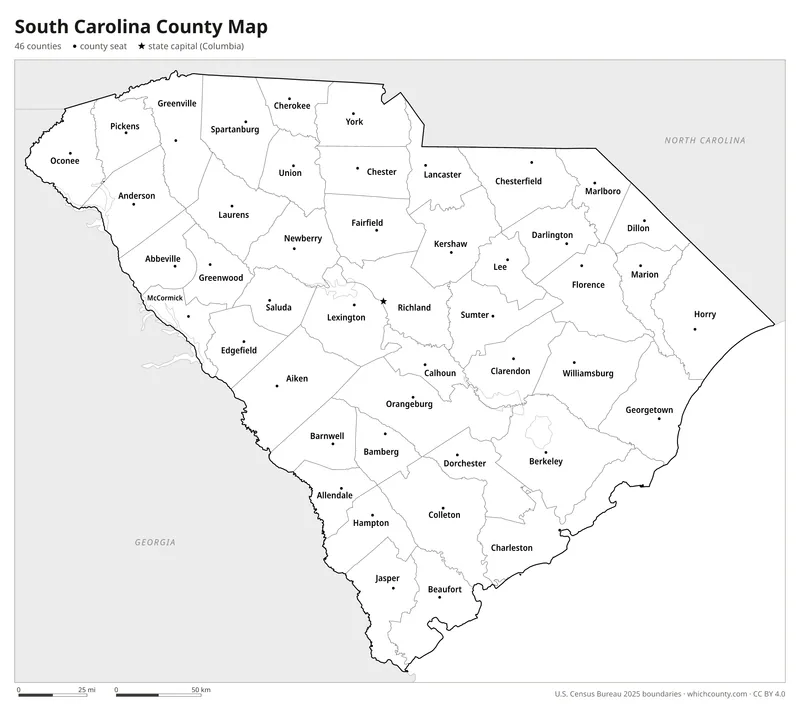
Black and white
Labeled map that prints well on any printer.
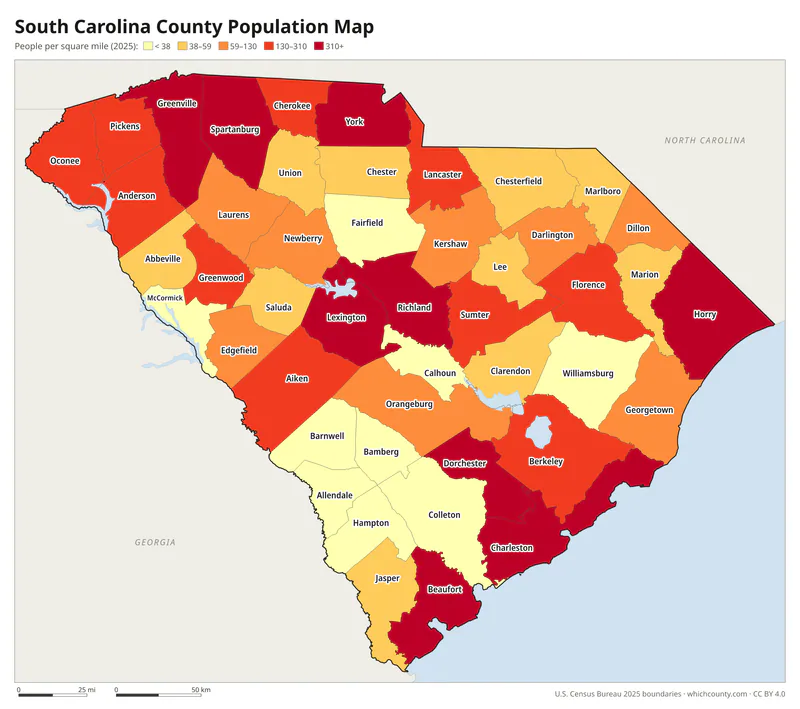
Population map
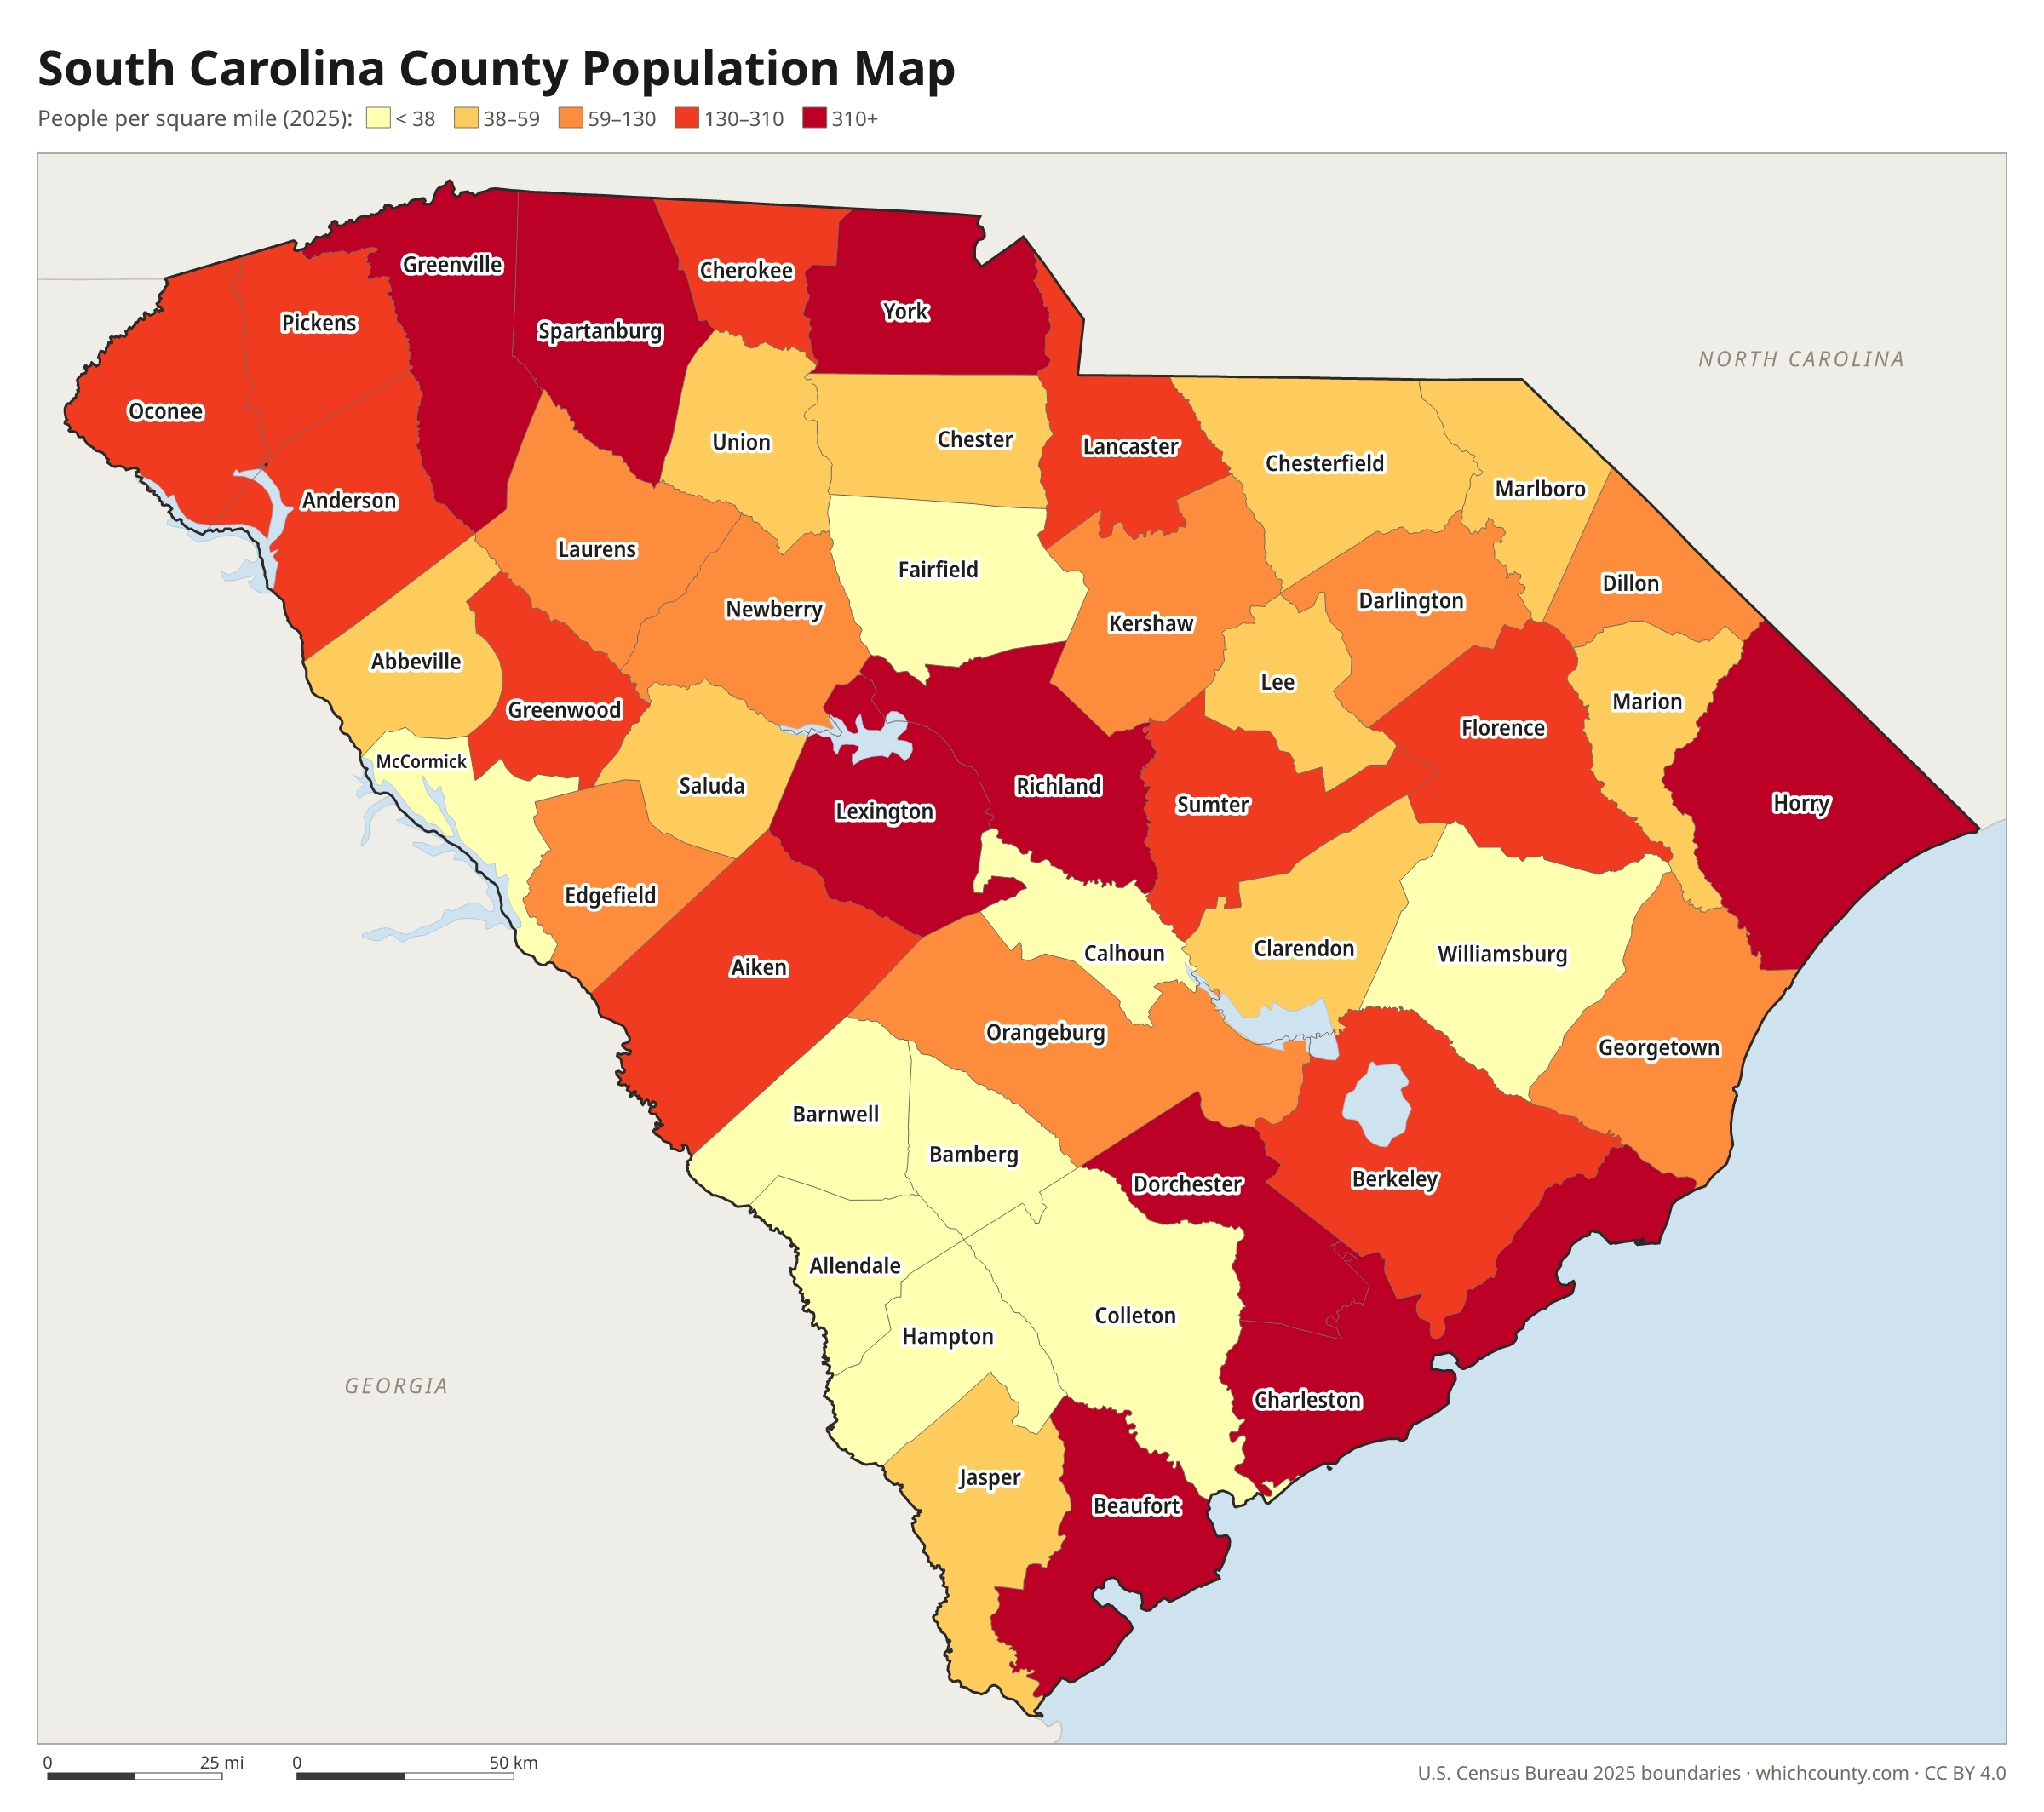
Counties shaded by population density (2025 estimates).
Data and GIS files
The county table as CSV, and the boundaries as GeoJSON and KML (Google Earth, Google My Maps).
From parishes and districts to South Carolina's counties
South Carolina tried several kinds of local units before it settled on counties. The Lords Proprietors created Berkeley, Craven and Colleton counties in 1682, but the parishes set up under the Church Act of 1706 became the colony's election districts. Seven judicial districts followed in 1769 to bring courts to the backcountry. The General Assembly created twenty counties in 1785, but by 1800 most had become judicial districts. The 1868 constitution renamed the districts counties and abolished the parishes. New counties need local consent: a third of the voters in the area must petition the governor, and two-thirds must approve in an election. A new county needs at least 400 square miles, and no old county may be cut within eight miles of its courthouse. Allendale, the youngest, was formed in 1919 because the trip to the courthouse in Barnwell or Hampton was inconvenient.
County maps of neighboring states
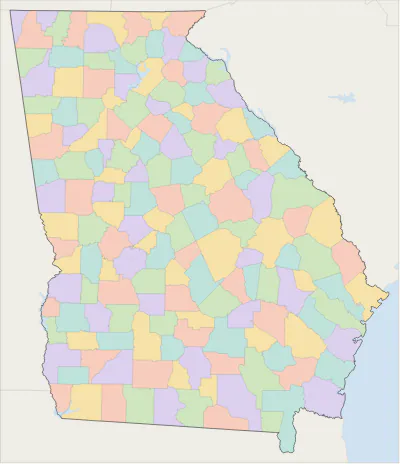 Georgia county map
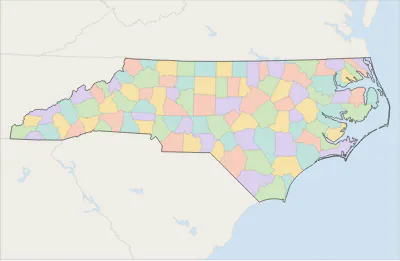 North Carolina county map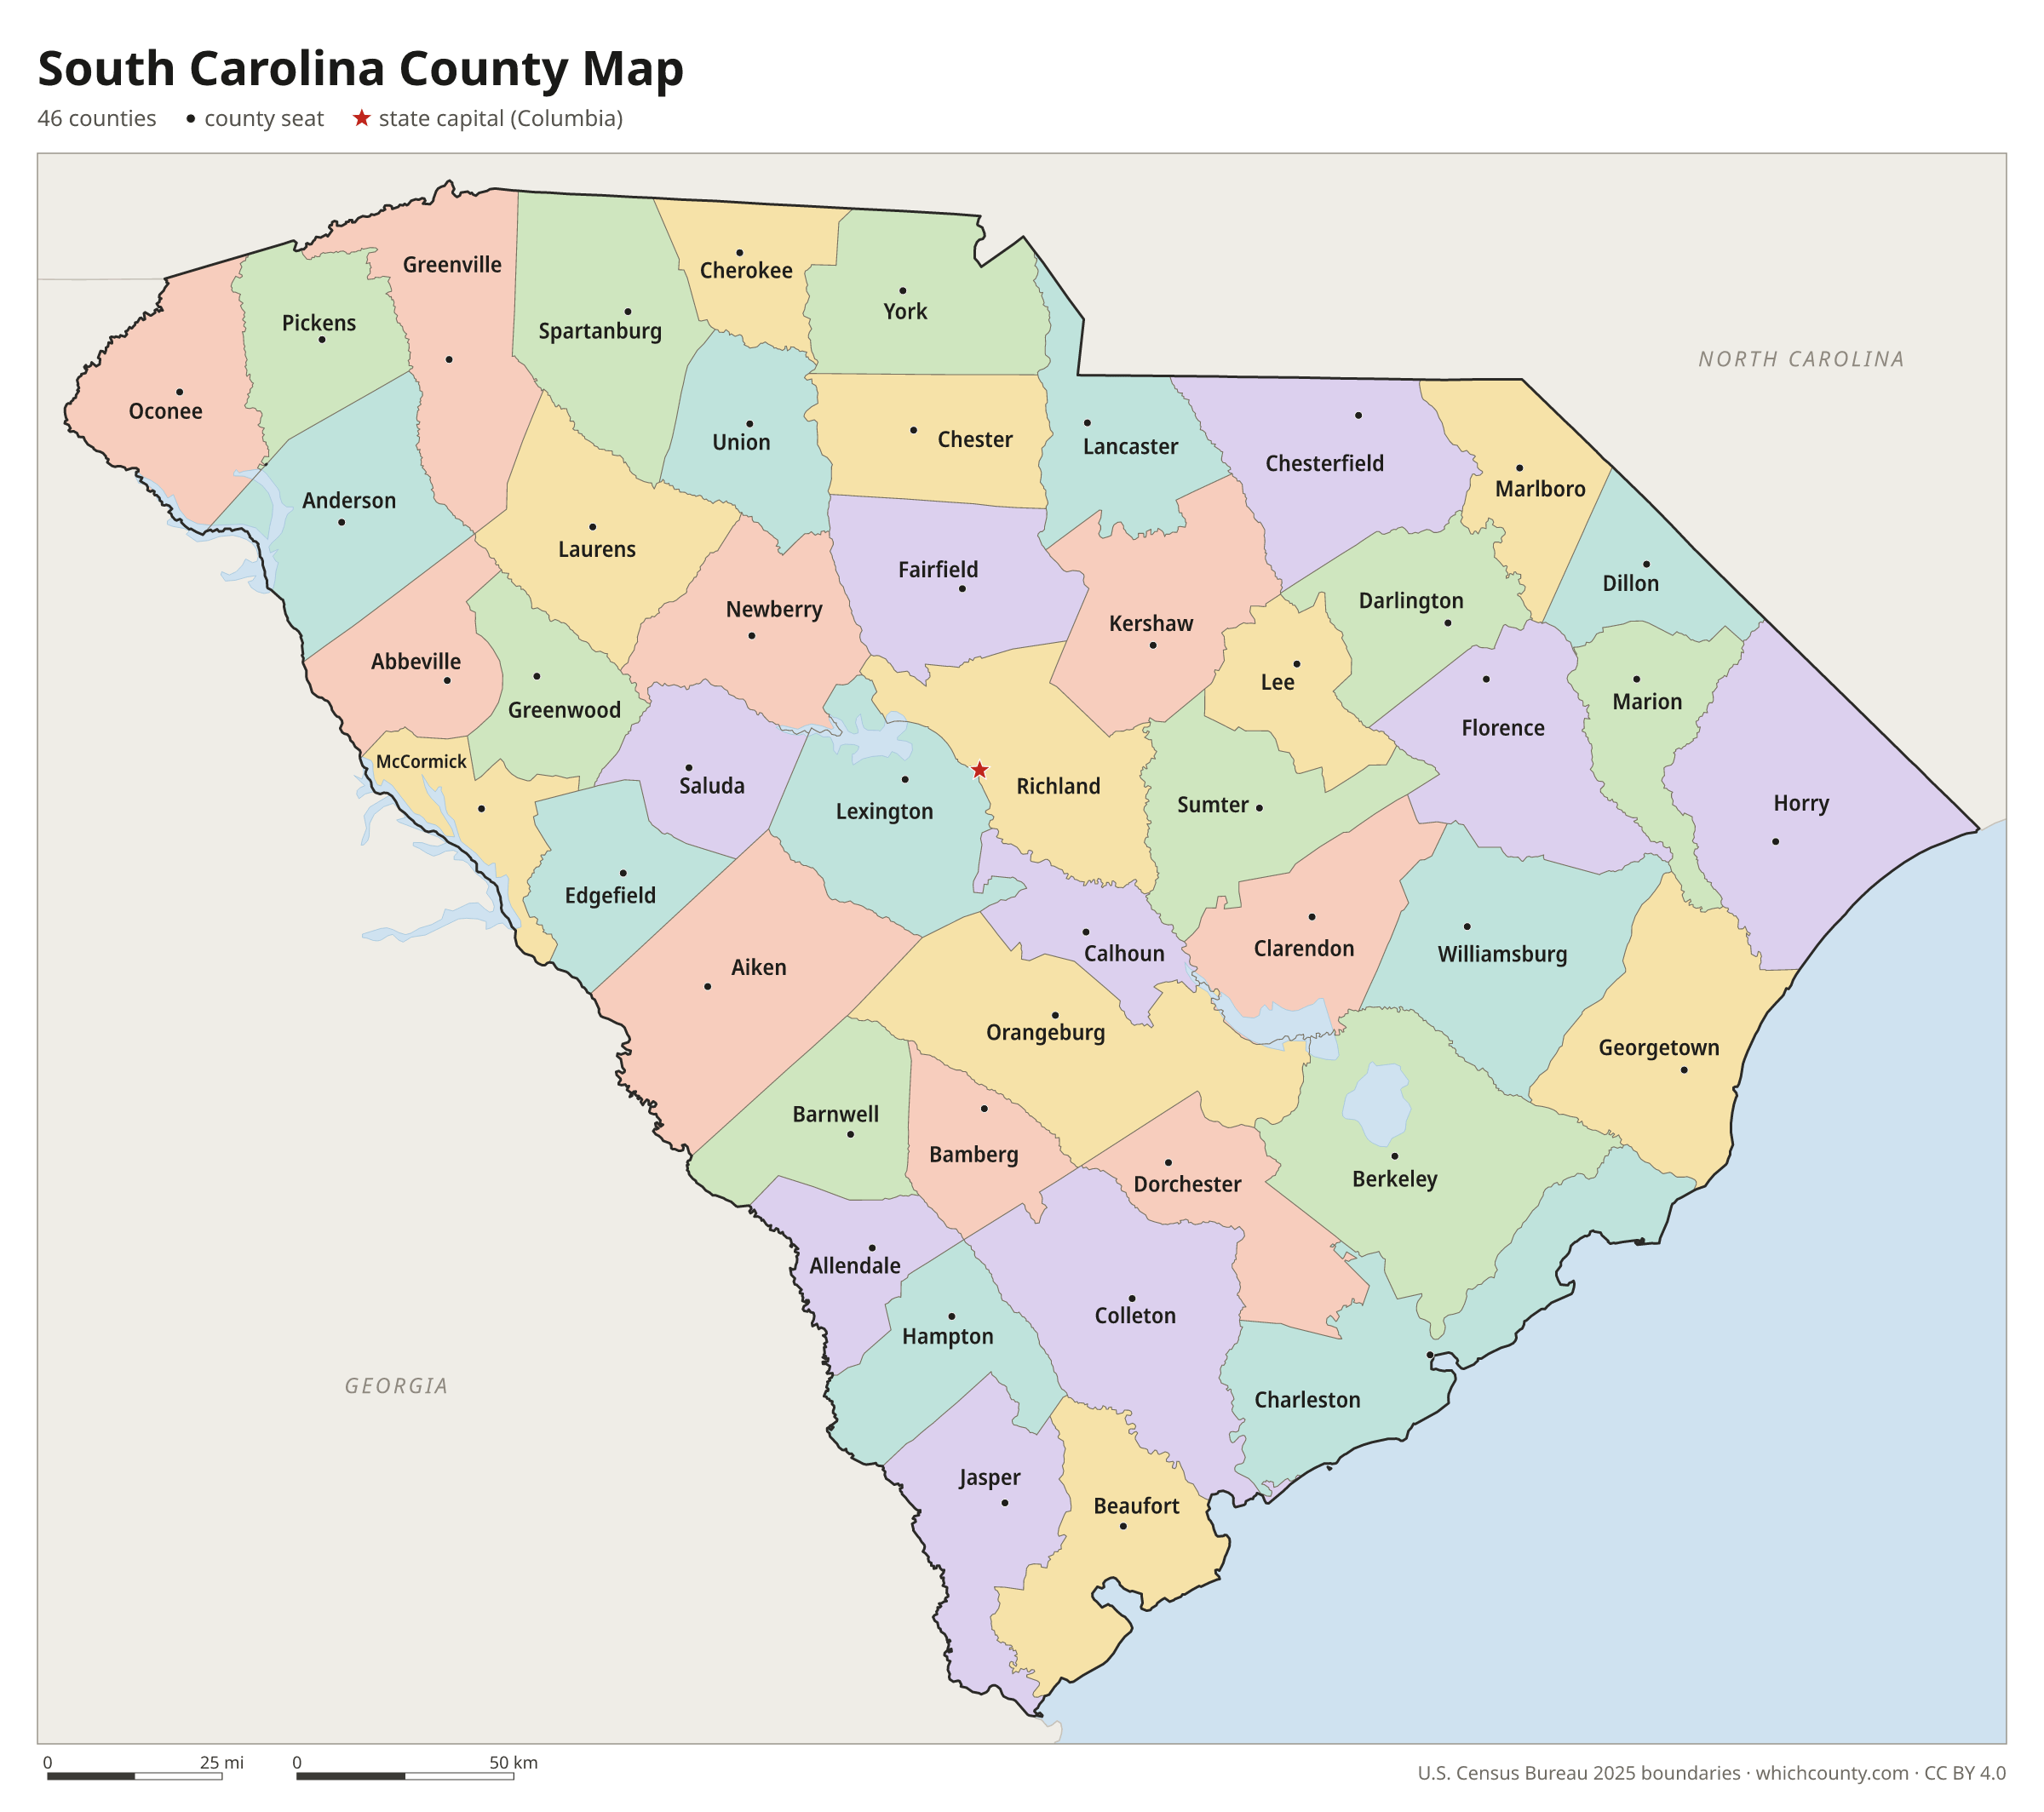
South Carolina counties: questions and answers
- How many counties are in South Carolina?
- South Carolina has 46 counties.
- What is the largest county in South Carolina?
- By land area, Horry County is the largest (1,133 sq mi). By population, Greenville County is the largest, with 583,125 people (2025 estimate).
- What is the smallest county in South Carolina?
- McCormick County is the smallest by land area (358.9 sq mi). Allendale County has the fewest people: 7,355 (2025 estimate).
- What is the wealthiest county in South Carolina?
- By median household income, York County ranks first with $89,095 (American Community Survey 2020–2024). The lowest is Allendale County at $32,328.
- What county is Charleston in?
- Charleston is mostly in Charleston County, with smaller parts in Berkeley County.
- What county is Columbia in?
- Columbia is mostly in Richland County, with smaller parts in Lexington and Kershaw counties.
- What county is North Charleston in?
- North Charleston is mostly in Charleston County, with smaller parts in Dorchester and Berkeley counties.
- How can I see county lines on Google Maps?
- Google Maps does not draw county lines. Download the KML file from the printable maps section above and import it into Google My Maps (Create a new map › Import) or open it in Google Earth to see every South Carolina county boundary on top of Google's map.
- Can I use this map for free?
- Yes. The maps and files on this page are free to print, share and use in your own work, including commercial projects, under the CC BY 4.0 licence. Please credit “WhichCounty (whichcounty.com)”.
Use this map on your site
You may copy, print and publish these maps, also commercially, as long as you credit WhichCounty with a link (licence details). Paste this code to embed the map:
Sources and methodology
- Boundaries: U.S. Census Bureau, 2025 Cartographic Boundary Files (1:500,000), simplified for display. Projection: Lambert conformal conic fitted to South Carolina.
- Population: Census Bureau county estimates, Vintage 2025 (July 1, 2025), compared with the April 1, 2020 estimates base.
- Land area: Census Bureau 2026 Gazetteer files. Median household income: American Community Survey 2020–2024 5-year estimates.
- County seats and founding years: Wikidata (CC0), checked against state lists by WhichCounty. Cities: Census Bureau city and town estimates, Vintage 2025.
- Counties, districts, and parishes (South Carolina Encyclopedia)
- Allendale County (South Carolina Encyclopedia)
- South Carolina Constitution, Article VII: Counties and County Government (South Carolina Legislature)
- Atlas of Historical County Boundaries: South Carolina (Newberry Library)
Found an error? Tell us. Last data update: October 4, 2026.