Illinois County Map
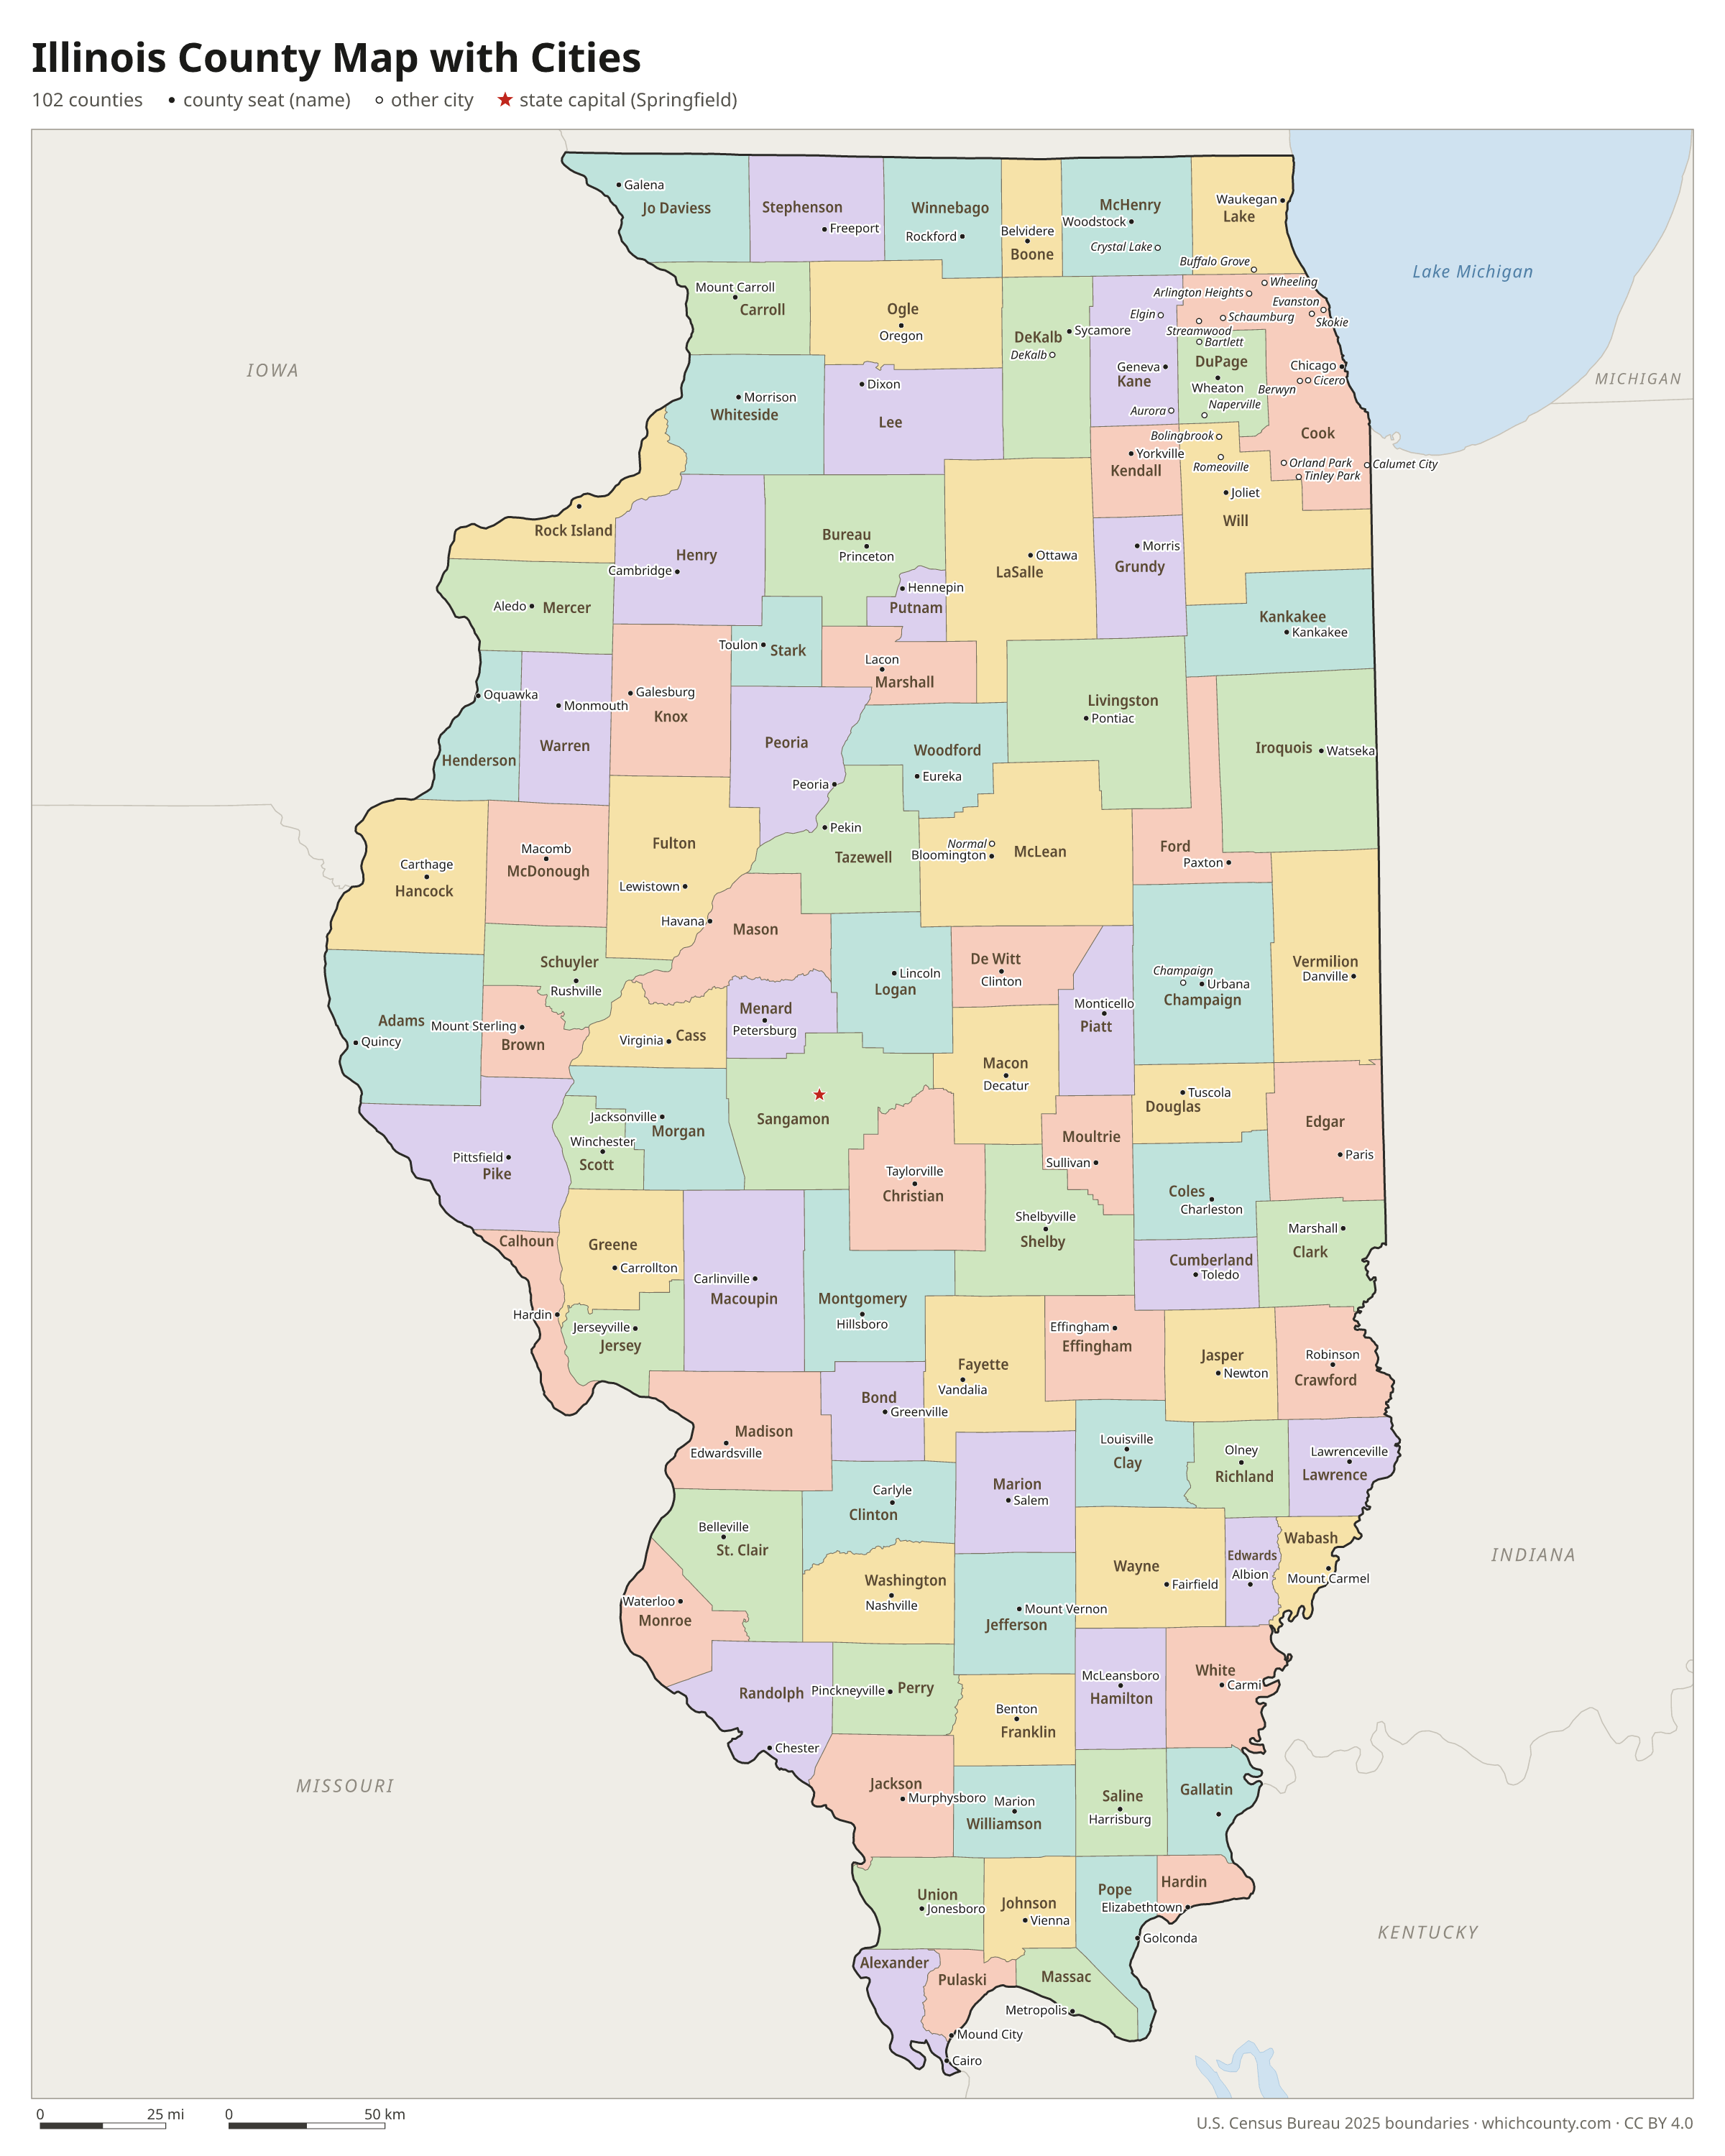
All 102 counties with county seats and major cities
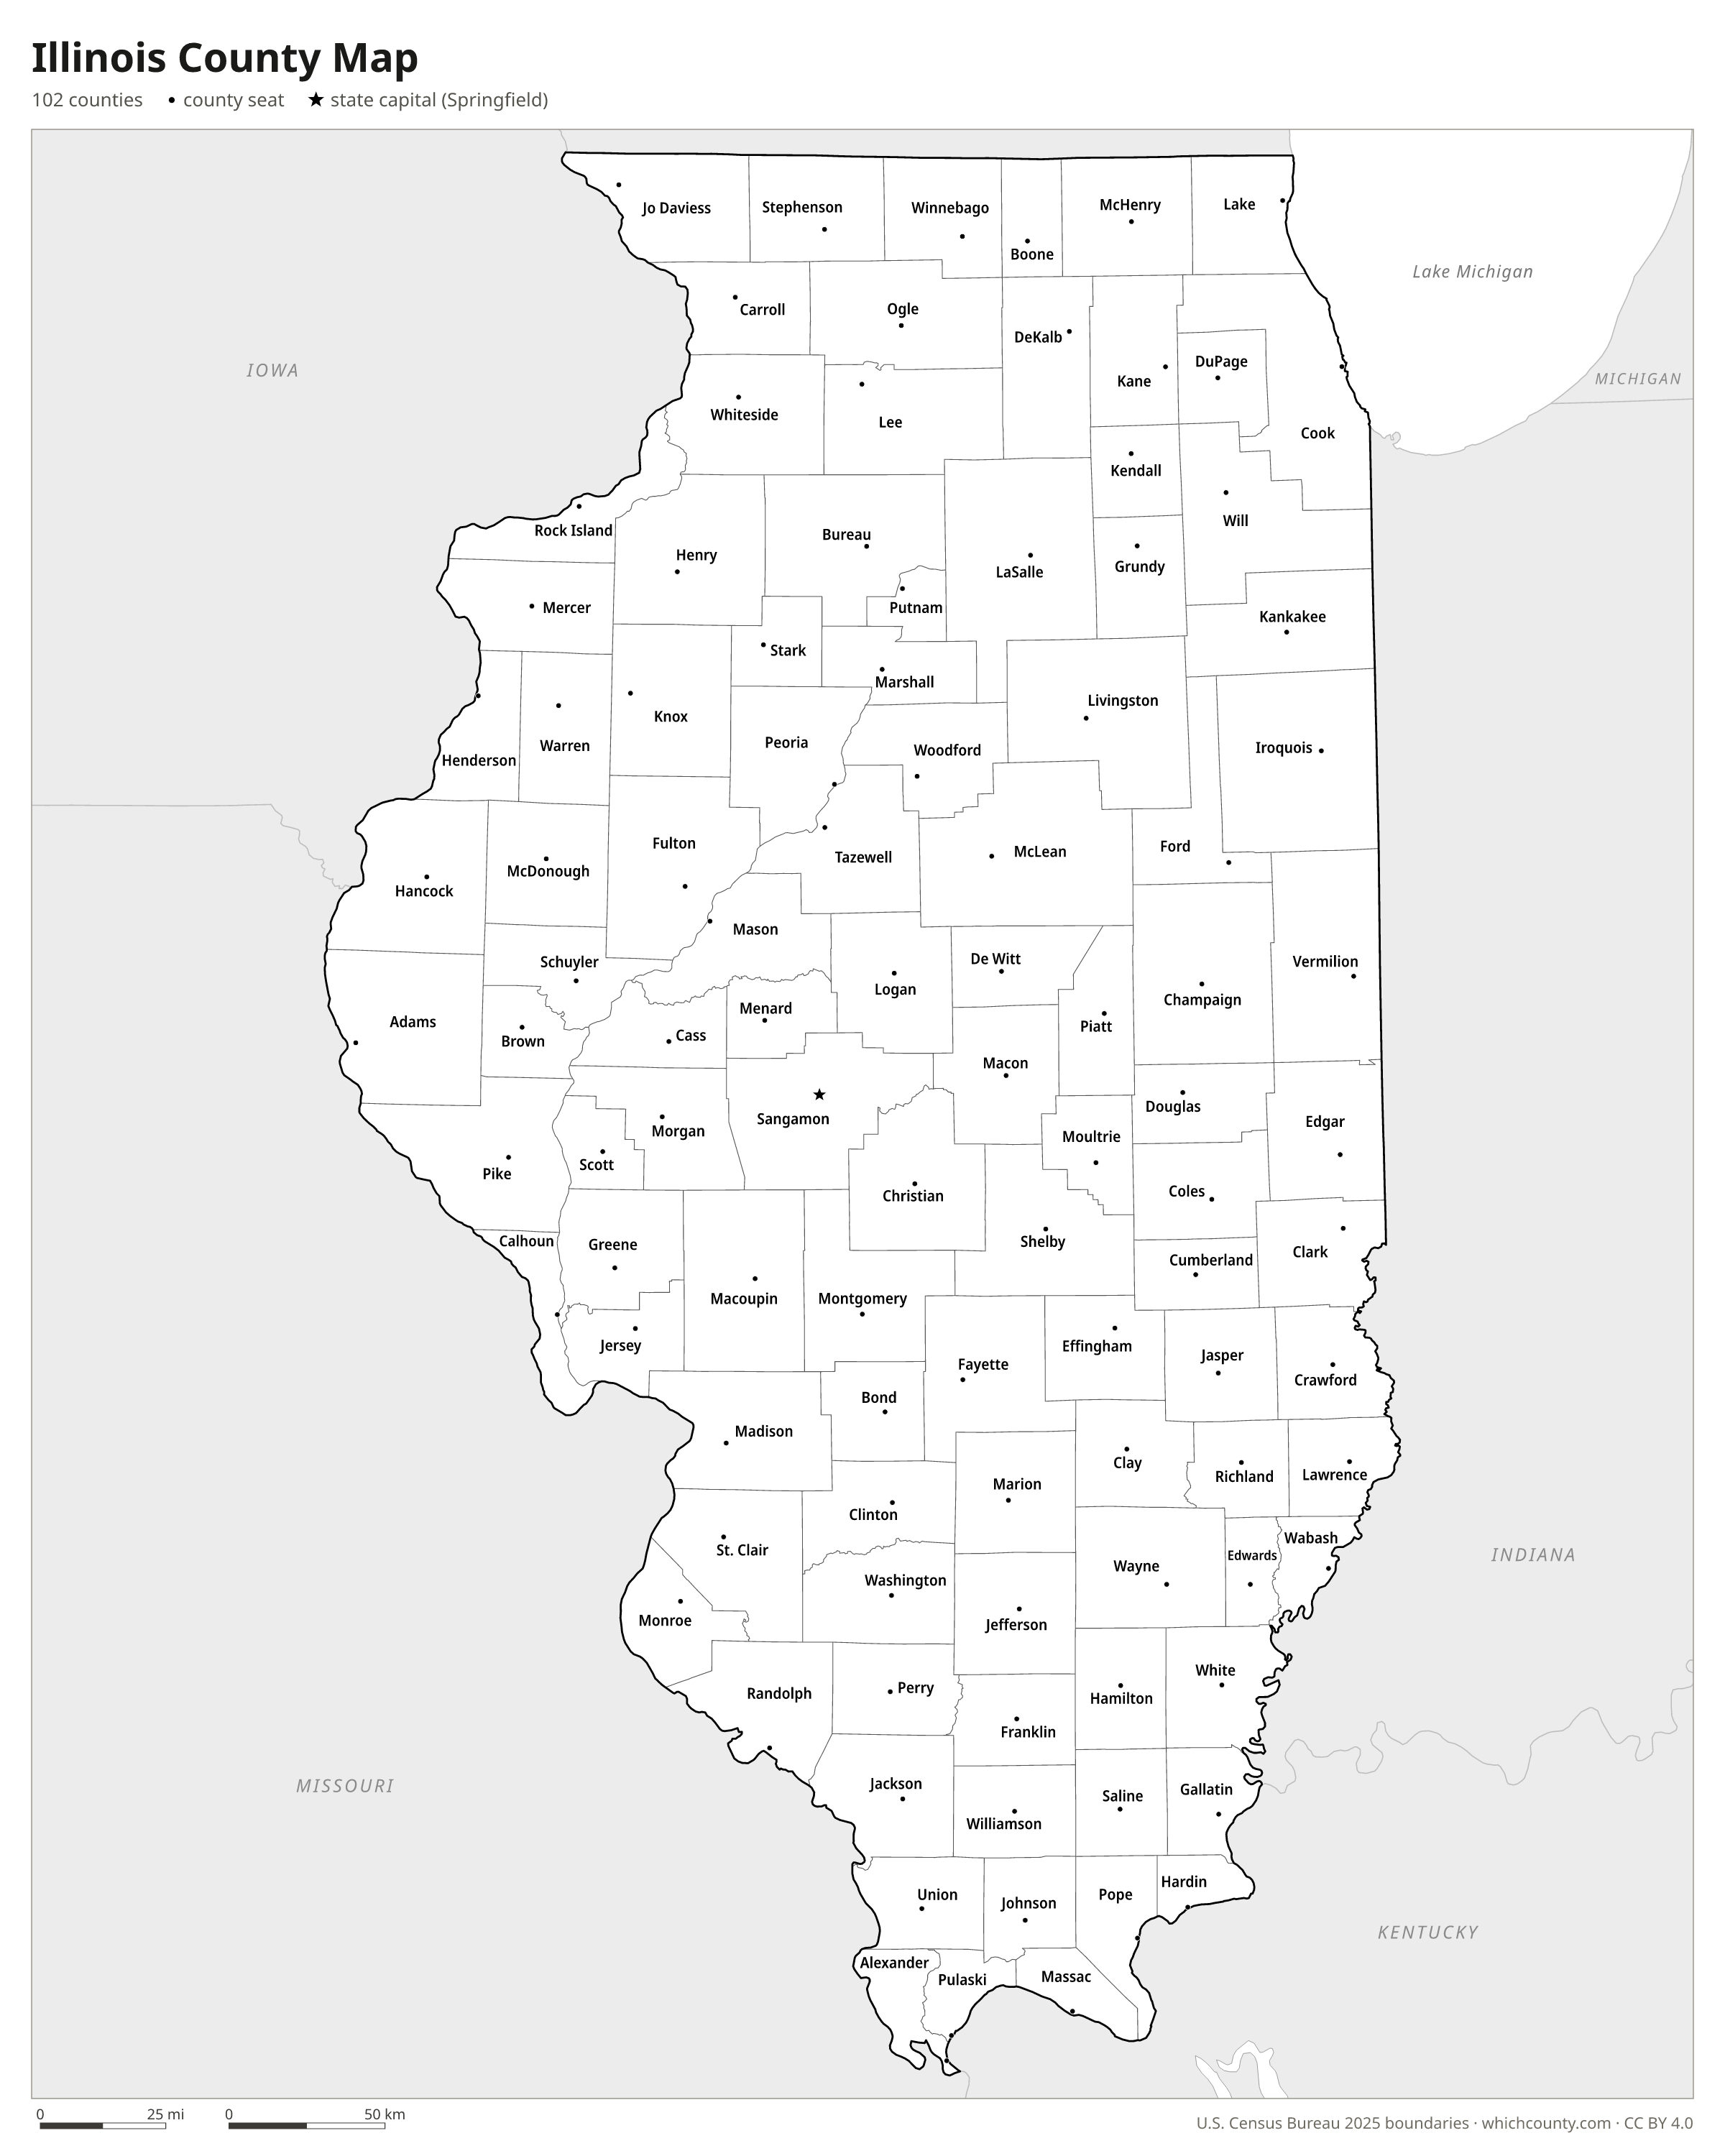
Illinois has 102 counties, the seventh-highest total among the states. This map shows all 102 counties and their county seats. Tap a county for details, or download the free printable map below.

Updated October 4, 2026 · Boundaries: U.S. Census Bureau 2025 · Population: Census estimates for July 1, 2025
Illinois county facts
- Number of counties
- 102
- Largest by land area
- McLean County 1,183 sq mi
- Smallest by land area
- Putnam County 160.1 sq mi
- Most people
- Cook County 5,194,625
- Fewest people
- Hardin County 3,588
- Fastest growing since 2020
- Kendall County +10.3%
- Highest median household income
- DuPage County $112,096
- Oldest county
- St. Clair County est. 1790
- Newest county
- Douglas County est. 1859
- State capital
- Springfield Sangamon County
List of 102 Illinois counties
Sorted A–Z. Click a column to sort, or a name to show it on the map. Download as CSV
| County | County seat | Population 2025 | Change since 2020 | Land area (sq mi) | Median income | Established | FIPS |
|---|---|---|---|---|---|---|---|
| Adams County | Quincy | 64,267 | −2.3% | 855 | $66,220 | 1825 | 17001 |
| Alexander County | Cairo | 4,570 | −12.8% | 235 | $47,043 | 1819 | 17003 |
| Bond County | Greenville | 16,959 | +0.4% | 380 | $65,959 | 1817 | 17005 |
| Boone County | Belvidere | 53,568 | +0.2% | 281 | $84,571 | 1837 | 17007 |
| Brown County | Mount Sterling | 6,401 | +2.5% | 306 | $67,917 | 1839 | 17009 |
| Bureau County | Princeton | 32,510 | −2.3% | 869 | $69,257 | 1837 | 17011 |
| Calhoun County | Hardin | 4,300 | −2.9% | 254 | $93,203 | 1825 | 17013 |
| Carroll County | Mount Carroll | 15,419 | −1.9% | 445 | $60,758 | 1839 | 17015 |
| Cass County | Virginia | 12,463 | −4.4% | 376 | $68,125 | 1837 | 17017 |
| Champaign County | Urbana | 209,972 | +1.7% | 996 | $63,683 | 1833 | 17019 |
| Christian County | Taylorville | 33,443 | −1.8% | 710 | $62,611 | 1839 | 17021 |
| Clark County | Marshall | 15,114 | −2.4% | 501 | $72,927 | 1819 | 17023 |
| Clay County | Louisville | 12,793 | −3.7% | 468 | $60,417 | 1824 | 17025 |
| Clinton County | Carlyle | 37,128 | +0.6% | 474 | $86,588 | 1824 | 17027 |
| Coles County | Charleston | 46,607 | −1.2% | 508 | $56,478 | 1830 | 17029 |
| Cook County | Chicago | 5,194,625 | −1.6% | 945 | $83,498 | 1831 | 17031 |
| Crawford County | Robinson | 18,648 | −0% | 444 | $71,674 | 1816 | 17033 |
| Cumberland County | Toledo | 10,208 | −2.3% | 346 | $73,327 | 1843 | 17035 |
| De Witt County | Clinton | 15,118 | −2.5% | 398 | $71,678 | 1839 | 17039 |
| DeKalb County | Sycamore | 101,835 | +1.3% | 631 | $70,724 | 1837 | 17037 |
| Douglas County | Tuscola | 19,880 | +0.7% | 417 | $77,320 | 1859 | 17041 |
| DuPage County | Wheaton | 934,298 | +0.1% | 328 | $112,096 | 1839 | 17043 |
| Edgar County | Paris | 16,323 | −3.3% | 623 | $59,941 | 1823 | 17045 |
| Edwards County | Albion | 5,898 | −5.5% | 222 | $60,519 | 1814 | 17047 |
| Effingham County | Effingham | 34,519 | −0.4% | 479 | $80,404 | 1831 | 17049 |
| Fayette County | Vandalia | 20,790 | −3.3% | 717 | $60,944 | 1821 | 17051 |
| Ford County | Paxton | 13,216 | −2.3% | 486 | $62,439 | 1859 | 17053 |
| Franklin County | Benton | 36,916 | −2.3% | 409 | $56,740 | 1818 | 17055 |
| Fulton County | Lewistown | 32,901 | −2.3% | 866 | $60,599 | 1823 | 17057 |
| Gallatin County | Shawneetown | 4,616 | −6.6% | 323 | $59,219 | 1812 | 17059 |
| Greene County | Carrollton | 11,313 | −5.5% | 543 | $62,192 | 1821 | 17061 |
| Grundy County | Morris | 54,052 | +2.8% | 418 | $92,235 | 1841 | 17063 |
| Hamilton County | McLeansboro | 7,859 | −1.7% | 435 | $65,746 | 1821 | 17065 |
| Hancock County | Carthage | 16,803 | −4.8% | 794 | $65,865 | 1825 | 17067 |
| Hardin County | Elizabethtown | 3,588 | −1.9% | 177 | $54,271 | 1839 | 17069 |
| Henderson County | Oquawka | 5,984 | −6.4% | 379 | $62,227 | 1841 | 17071 |
| Henry County | Cambridge | 48,095 | −2.4% | 823 | $71,911 | 1825 | 17073 |
| Iroquois County | Watseka | 26,150 | −3.4% | 1,117 | $66,255 | 1833 | 17075 |
| Jackson County | Murphysboro | 52,501 | −1.6% | 584 | $48,763 | 1816 | 17077 |
| Jasper County | Newton | 9,032 | −2.9% | 495 | $74,755 | 1831 | 17079 |
| Jefferson County | Mount Vernon | 36,147 | −2.6% | 571 | $63,118 | 1819 | 17081 |
| Jersey County | Jerseyville | 21,160 | −1.7% | 370 | $80,361 | 1839 | 17083 |
| Jo Daviess County | Galena | 21,594 | −2.2% | 601 | $73,993 | 1827 | 17085 |
| Johnson County | Vienna | 13,363 | +0.4% | 344 | $62,528 | 1812 | 17087 |
| Kane County | Geneva | 525,757 | +1.8% | 519 | $103,163 | 1836 | 17089 |
| Kankakee County | Kankakee | 105,525 | −2% | 677 | $71,281 | 1853 | 17091 |
| Kendall County | Yorkville | 145,470 | +10.3% | 320 | $111,601 | 1841 | 17093 |
| Knox County | Galesburg | 47,767 | −4.4% | 716 | $57,030 | 1825 | 17095 |
| LaSalle County | Ottawa | 107,773 | −1.7% | 1,135 | $73,045 | 1831 | 17099 |
| Lake County | Waukegan | 719,339 | +0.7% | 444 | $110,416 | 1839 | 17097 |
| Lawrence County | Lawrenceville | 13,790 | −9.9% | 372 | $55,324 | 1821 | 17101 |
| Lee County | Dixon | 32,914 | −3.6% | 725 | $70,292 | 1839 | 17103 |
| Livingston County | Pontiac | 35,057 | −2.2% | 1,044 | $73,790 | 1837 | 17105 |
| Logan County | Lincoln | 27,182 | −2.9% | 618 | $66,358 | 1839 | 17107 |
| Macon County | Decatur | 99,300 | −4.5% | 581 | $62,666 | 1829 | 17115 |
| Macoupin County | Carlinville | 43,748 | −2.9% | 863 | $70,805 | 1829 | 17117 |
| Madison County | Edwardsville | 263,110 | −1.1% | 716 | $75,793 | 1812 | 17119 |
| Marion County | Salem | 36,382 | −3.6% | 573 | $61,240 | 1823 | 17121 |
| Marshall County | Lacon | 11,473 | −2.4% | 387 | $71,585 | 1839 | 17123 |
| Mason County | Havana | 12,411 | −5.1% | 539 | $62,845 | 1841 | 17125 |
| Massac County | Metropolis | 13,502 | −4.8% | 237 | $65,116 | 1843 | 17127 |
| McDonough County | Macomb | 25,916 | −4.9% | 589 | $52,795 | 1826 | 17109 |
| McHenry County | Woodstock | 317,751 | +2.4% | 603 | $104,802 | 1836 | 17111 |
| McLean County | Bloomington | 171,419 | +0.1% | 1,183 | $79,905 | 1830 | 17113 |
| Menard County | Petersburg | 11,863 | −3.5% | 314 | $82,176 | 1839 | 17129 |
| Mercer County | Aledo | 15,229 | −3% | 561 | $74,182 | 1825 | 17131 |
| Monroe County | Waterloo | 34,840 | −0.3% | 385 | $102,880 | 1816 | 17133 |
| Montgomery County | Hillsboro | 28,076 | −0.9% | 704 | $63,620 | 1821 | 17135 |
| Morgan County | Jacksonville | 32,515 | −3.1% | 569 | $66,306 | 1823 | 17137 |
| Moultrie County | Sullivan | 14,371 | −1.1% | 336 | $71,784 | 1843 | 17139 |
| Ogle County | Oregon | 51,399 | −0.9% | 759 | $82,132 | 1836 | 17141 |
| Peoria County | Peoria | 178,553 | −1.9% | 619 | $65,108 | 1825 | 17143 |
| Perry County | Pinckneyville | 20,160 | −3.7% | 442 | $62,118 | 1827 | 17145 |
| Piatt County | Monticello | 16,791 | +0.6% | 439 | $94,811 | 1841 | 17147 |
| Pike County | Pittsfield | 14,231 | −3.4% | 831 | $59,777 | 1821 | 17149 |
| Pope County | Golconda | 3,672 | −2.5% | 369 | $60,050 | 1816 | 17151 |
| Pulaski County | Mound City | 4,820 | −7.4% | 199 | $42,463 | 1843 | 17153 |
| Putnam County | Hennepin | 5,619 | −0.2% | 160 | $75,590 | 1825 | 17155 |
| Randolph County | Chester | 29,921 | −0.8% | 575 | $68,131 | 1795 | 17157 |
| Richland County | Olney | 15,219 | −3.8% | 360 | $62,455 | 1841 | 17159 |
| Rock Island County | Rock Island | 141,869 | −1.9% | 428 | $67,159 | 1831 | 17161 |
| Saline County | Harrisburg | 22,772 | −4.4% | 380 | $53,117 | 1847 | 17165 |
| Sangamon County | Springfield | 194,170 | −1.1% | 868 | $75,357 | 1821 | 17167 |
| Schuyler County | Rushville | 6,657 | −3.5% | 437 | $65,948 | 1825 | 17169 |
| Scott County | Winchester | 4,866 | −4.1% | 251 | $66,705 | 1839 | 17171 |
| Shelby County | Shelbyville | 20,576 | −2% | 759 | $72,095 | 1827 | 17173 |
| St. Clair County | Belleville | 250,708 | −2.7% | 658 | $73,854 | 1790 | 17163 |
| Stark County | Toulon | 5,319 | −1.4% | 288 | $62,878 | 1839 | 17175 |
| Stephenson County | Freeport | 43,220 | −3.3% | 564 | $64,043 | 1837 | 17177 |
| Tazewell County | Pekin | 130,049 | −1.2% | 647 | $77,982 | 1827 | 17179 |
| Union County | Jonesboro | 16,656 | −4% | 413 | $55,728 | 1818 | 17181 |
| Vermilion County | Danville | 71,259 | −4% | 898 | $56,877 | 1826 | 17183 |
| Wabash County | Mount Carmel | 10,907 | −4% | 223 | $57,086 | 1824 | 17185 |
| Warren County | Monmouth | 16,222 | −3.7% | 542 | $67,385 | 1825 | 17187 |
| Washington County | Nashville | 13,564 | −1.5% | 563 | $78,224 | 1818 | 17189 |
| Wayne County | Fairfield | 15,882 | −1.9% | 714 | $55,521 | 1819 | 17191 |
| White County | Carmi | 13,250 | −4.5% | 495 | $54,813 | 1815 | 17193 |
| Whiteside County | Morrison | 54,121 | −2.8% | 684 | $67,500 | 1836 | 17195 |
| Will County | Joliet | 712,253 | +2.1% | 836 | $109,984 | 1836 | 17197 |
| Williamson County | Marion | 67,225 | +0.1% | 420 | $65,604 | 1839 | 17199 |
| Winnebago County | Rockford | 283,674 | −0.6% | 513 | $65,837 | 1836 | 17201 |
| Woodford County | Eureka | 38,111 | −0.9% | 528 | $91,483 | 1841 | 17203 |
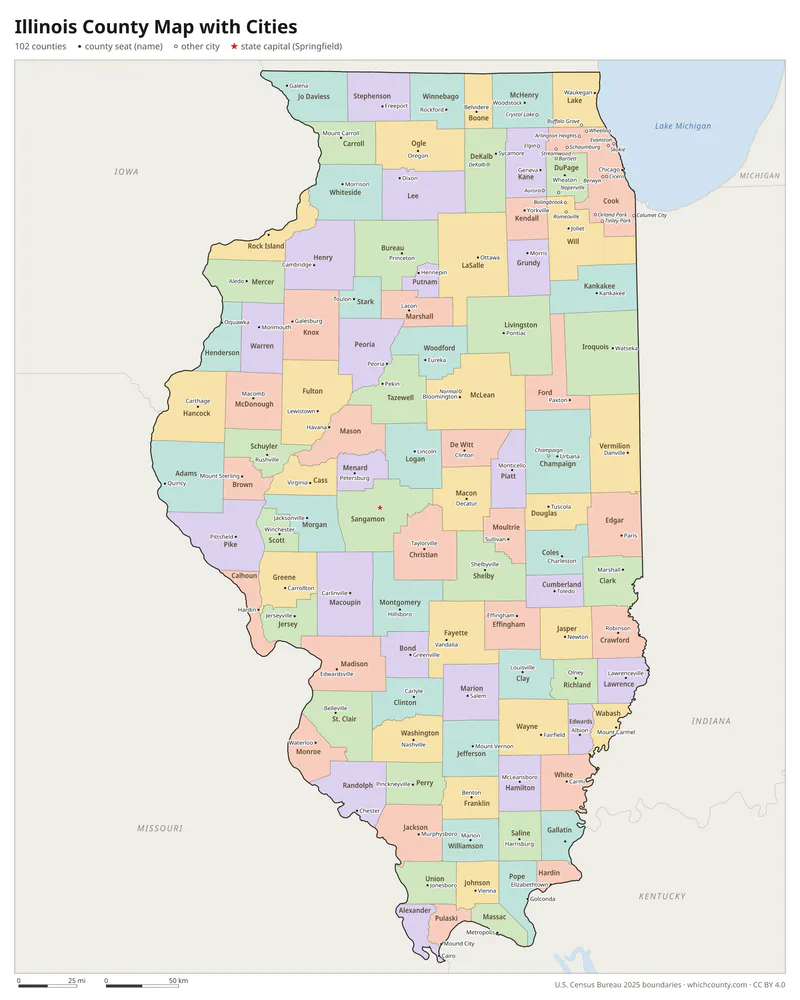
Illinois county map with cities
The largest cities in Illinois and the counties they are in. Cities that cross a county line list every county, the main one first. To find any smaller town, use the search box above.
| City | County | Population 2025 |
|---|---|---|
| Chicago | Cook and DuPage counties | 2,731,585 |
| Aurora | Kane, DuPage, Will and Kendall counties | 181,505 |
| Naperville | DuPage and Will counties | 153,114 |
| Joliet | Will and Kendall counties | 152,241 |
| Rockford | Winnebago and Ogle counties | 147,384 |
| Elgin | Kane and Cook counties | 115,476 |
| Springfield | Sangamon County | 112,989 |
| Peoria | Peoria County | 110,920 |
| Champaign | Champaign County | 91,195 |
| Waukegan | Lake County | 87,940 |
| Cicero | Cook County | 81,858 |
| Bloomington | McLean County | 78,804 |
| Schaumburg | Cook and DuPage counties | 77,249 |
| Evanston | Cook County | 76,380 |
| Arlington Heights | Cook County | 76,216 |
| Bolingbrook | Will and DuPage counties | 74,803 |
| Decatur | Macon County | 67,884 |
| Skokie | Cook County | 66,544 |
| Palatine | Cook County | 65,842 |
| Des Plaines | Cook County | 58,772 |
| Orland Park | Cook and Will counties | 57,954 |
| Oak Lawn | Cook County | 56,450 |
| Mount Prospect | Cook County | 55,395 |
| Tinley Park | Cook and Will counties | 55,140 |
| Berwyn | Cook County | 55,001 |
| Wheaton | DuPage County | 54,065 |
| Normal | McLean County | 53,275 |
| Oak Park | Cook County | 52,823 |
| Hoffman Estates | Cook County | 50,858 |
| Downers Grove | DuPage County | 50,365 |
Printable Illinois county maps (free PDF, PNG, SVG)
Every map is free to print and share. The PDFs are vector files with real text, so they stay sharp at any size and you can search them for a county name. Use 11×17 (tabloid) for the most readable labels.
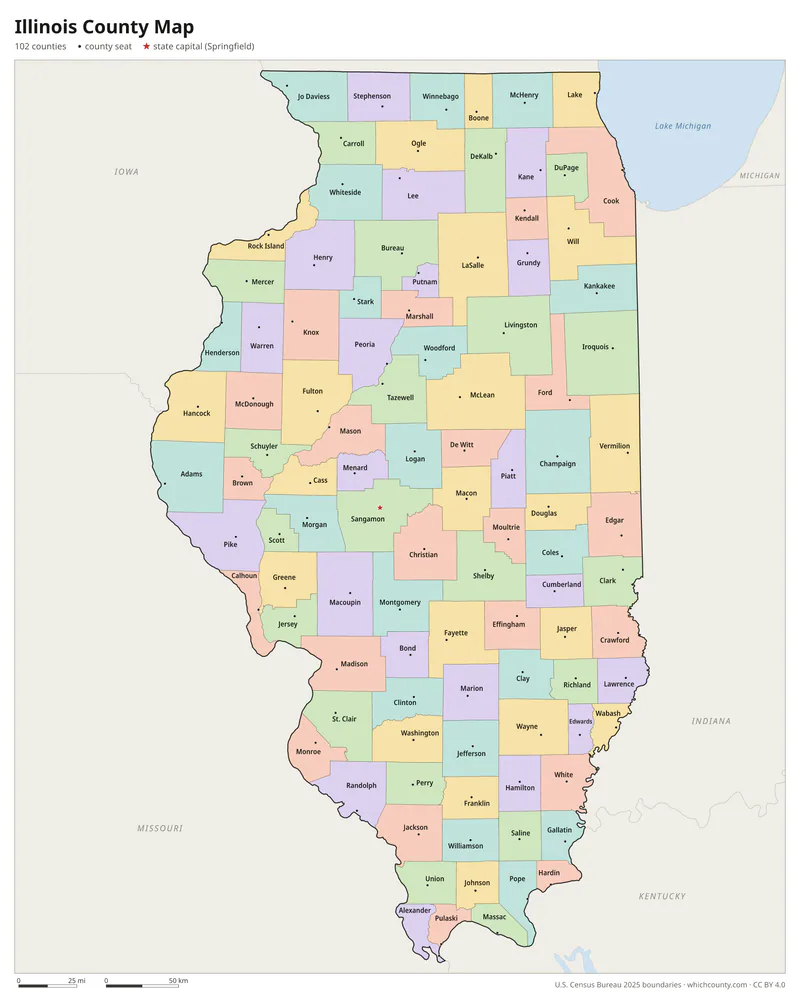
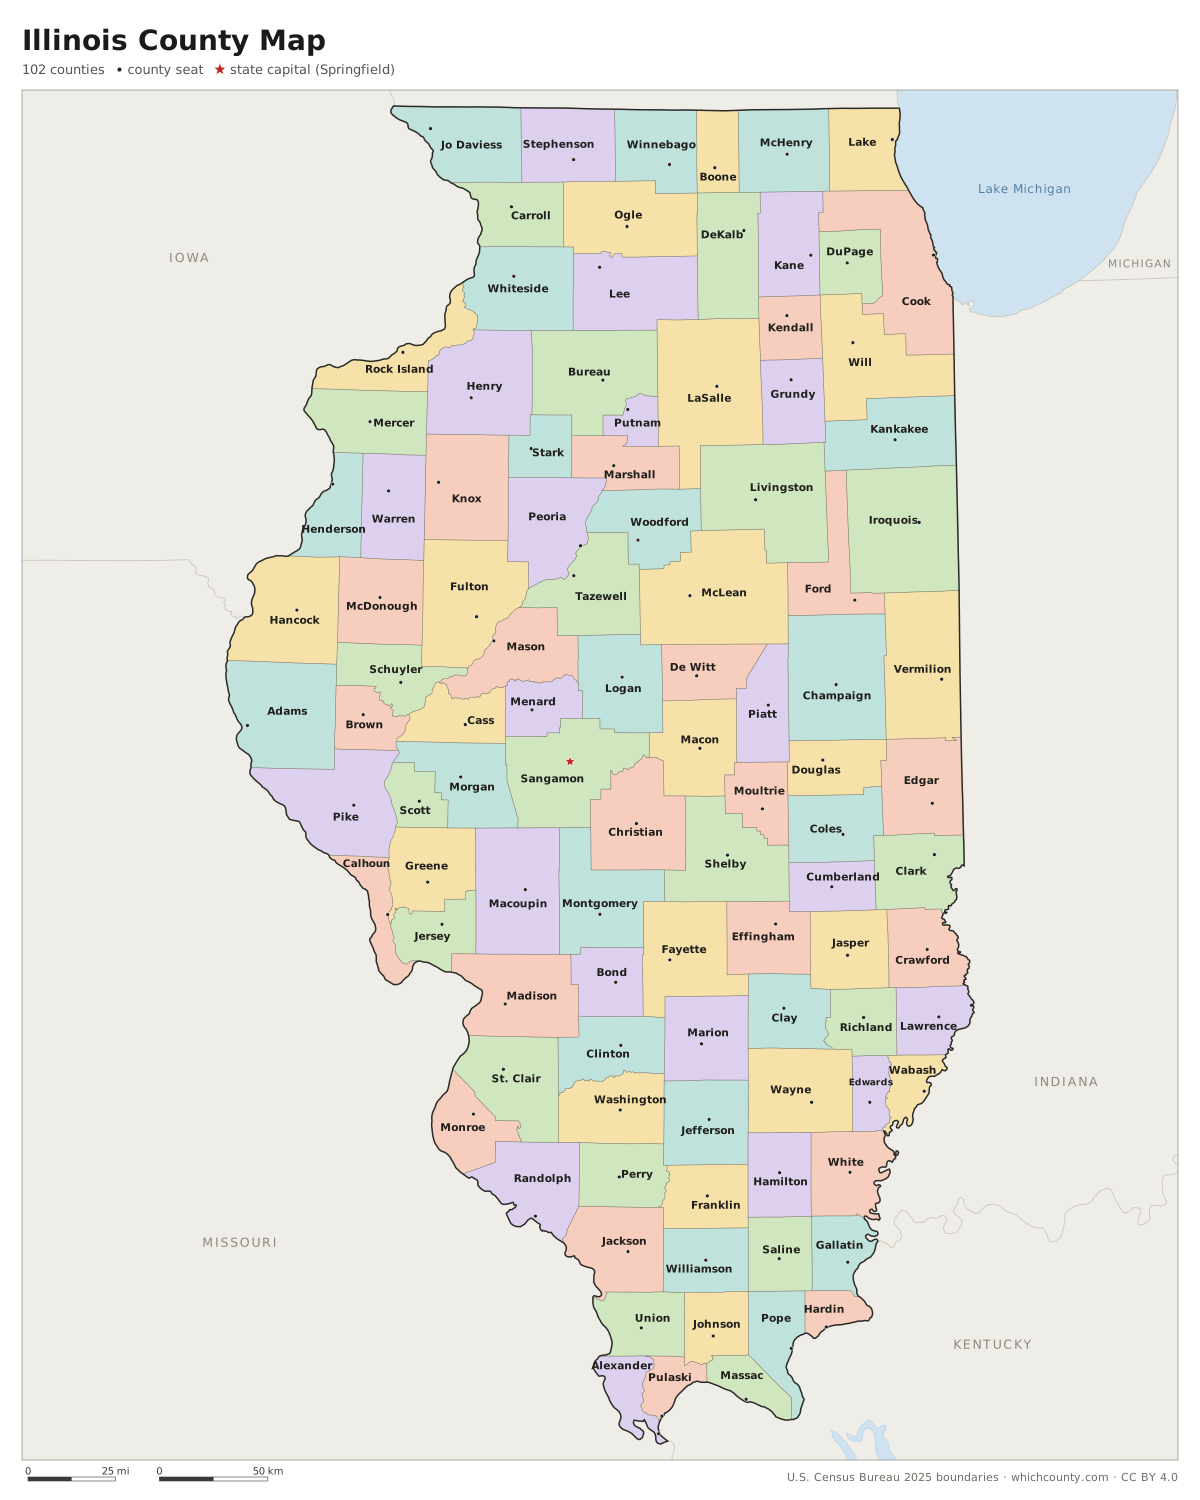
Color map with names
All 102 counties labeled, county seats marked. Letter and 11×17 PDF, high-resolution PNG, editable SVG.
Map with cities
Counties with their county seat towns and major cities.
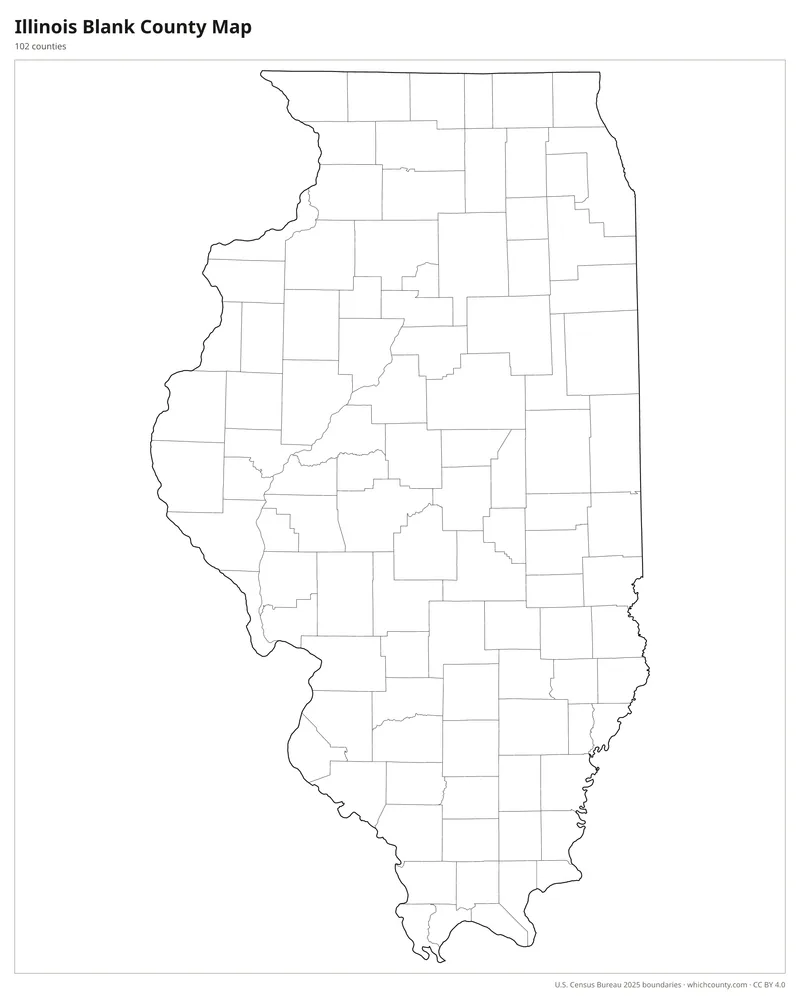
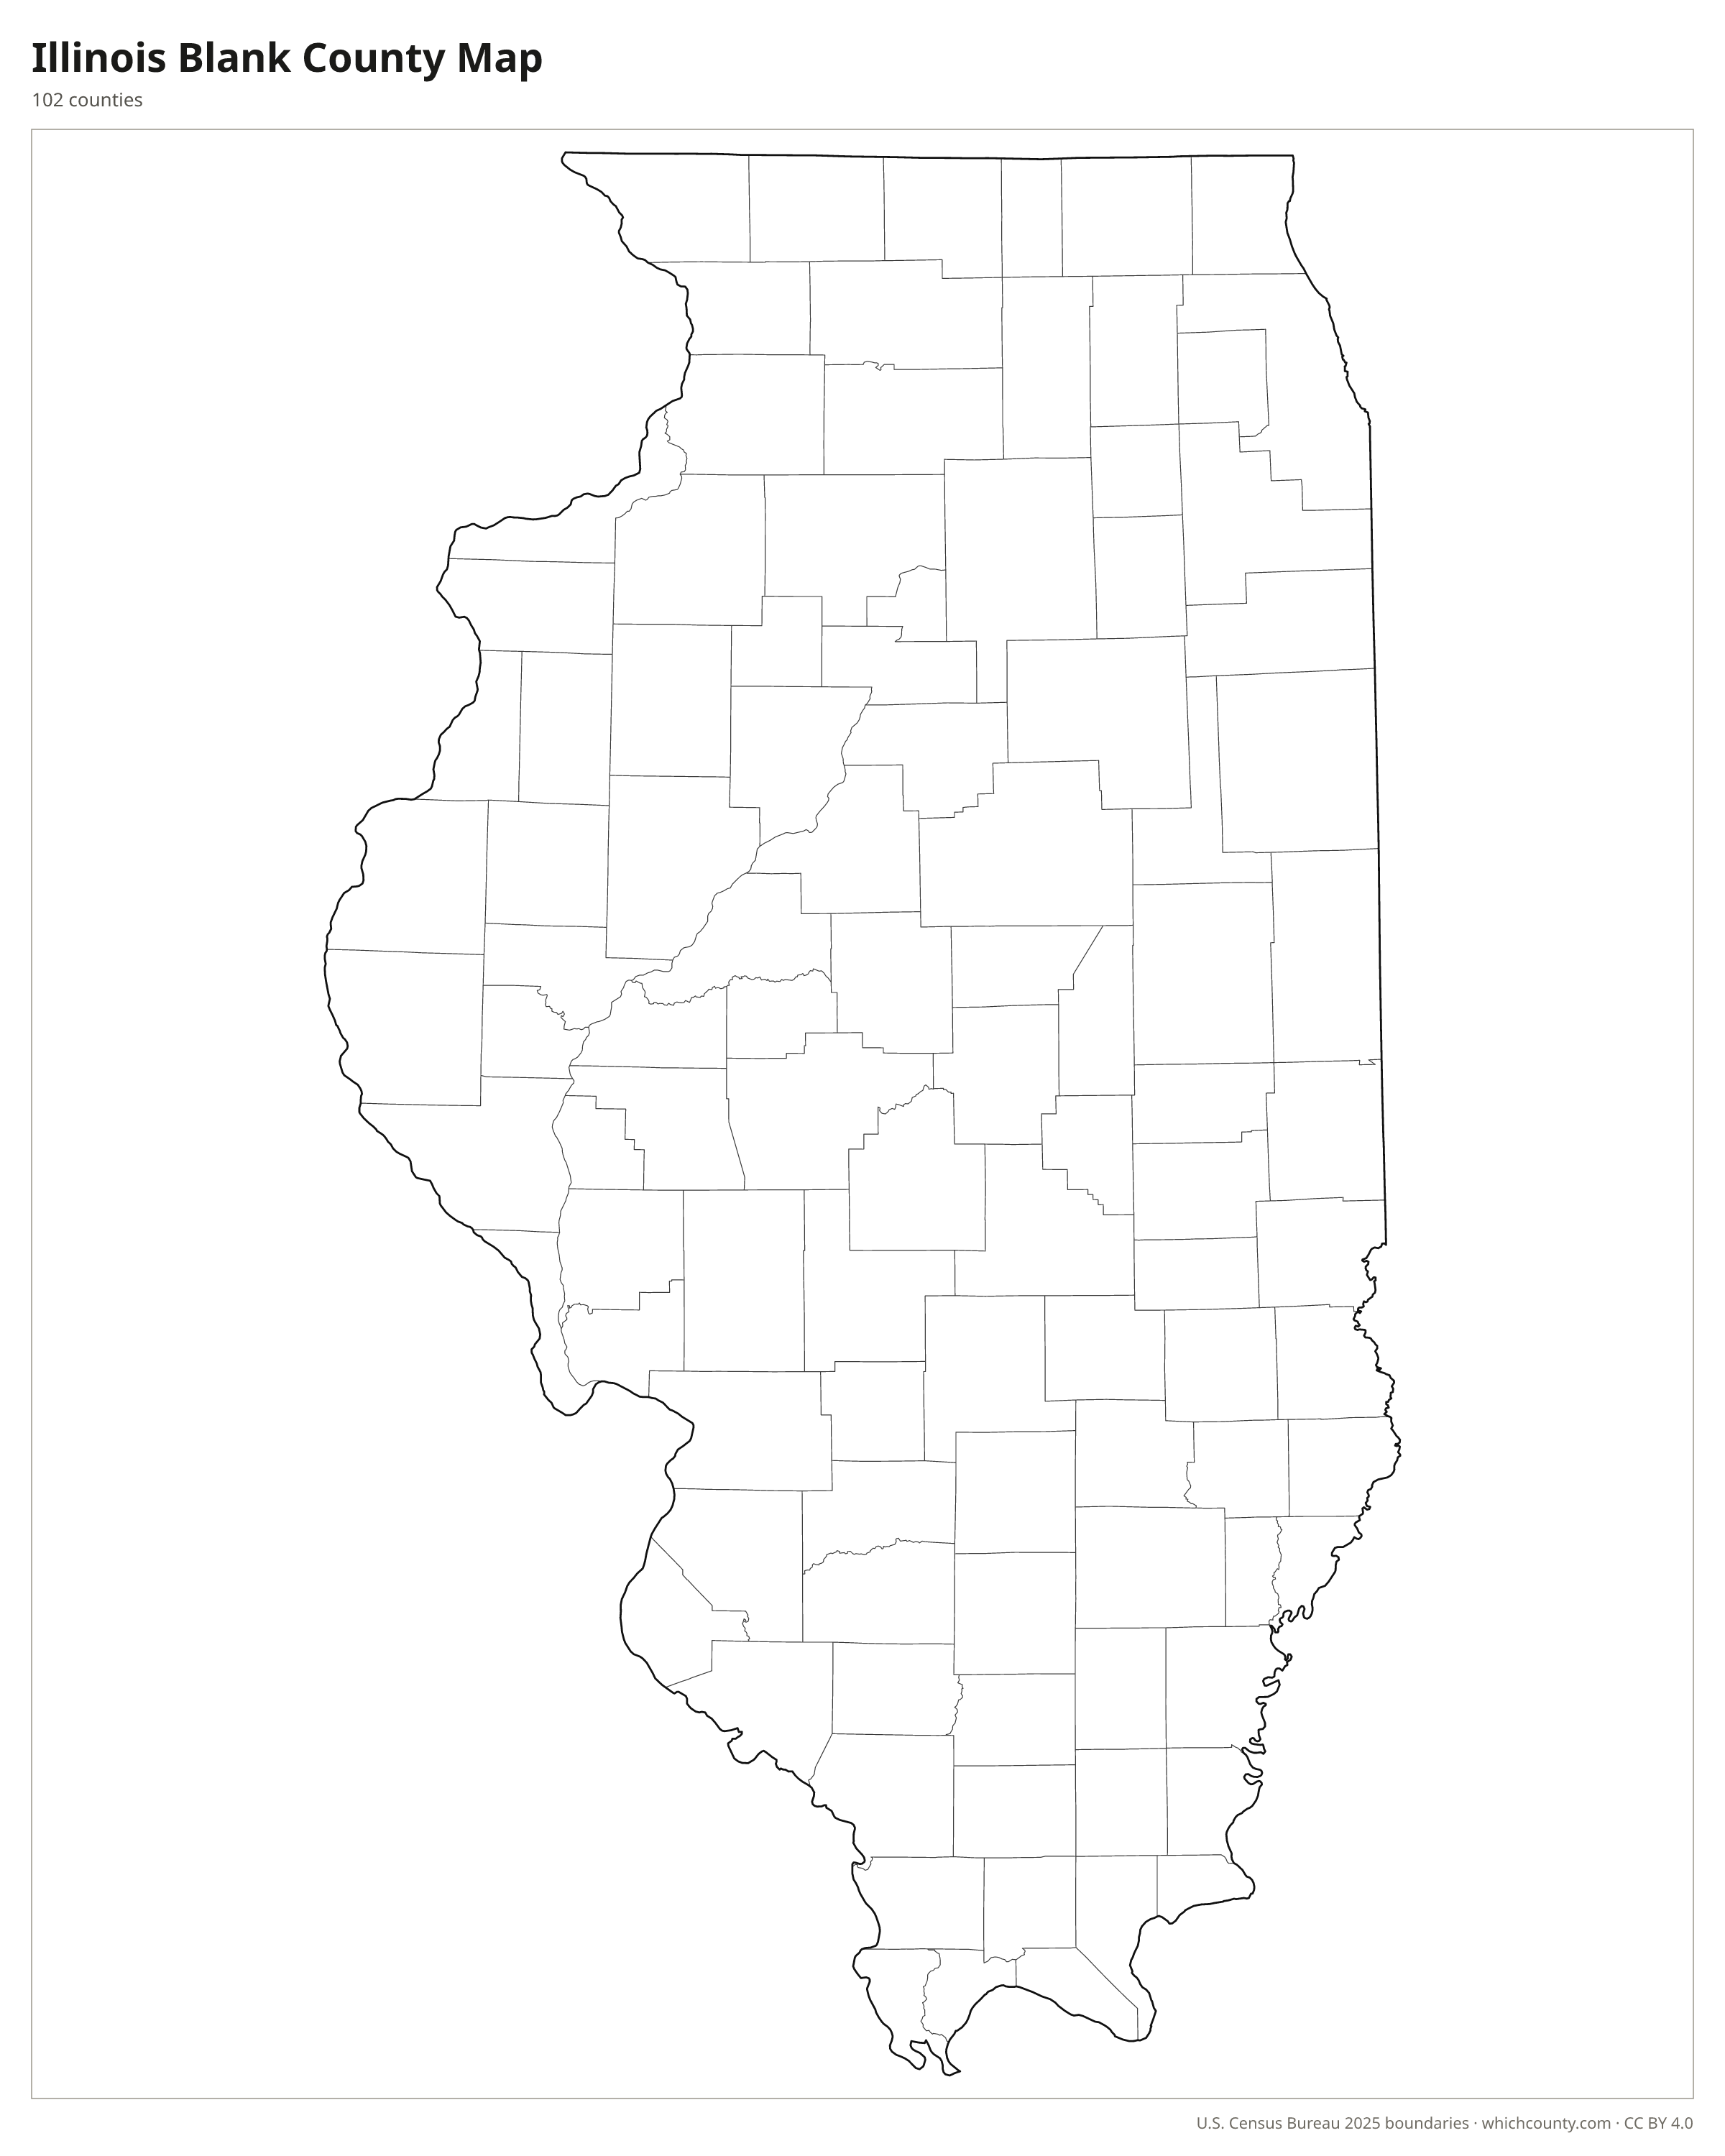
Blank outline map
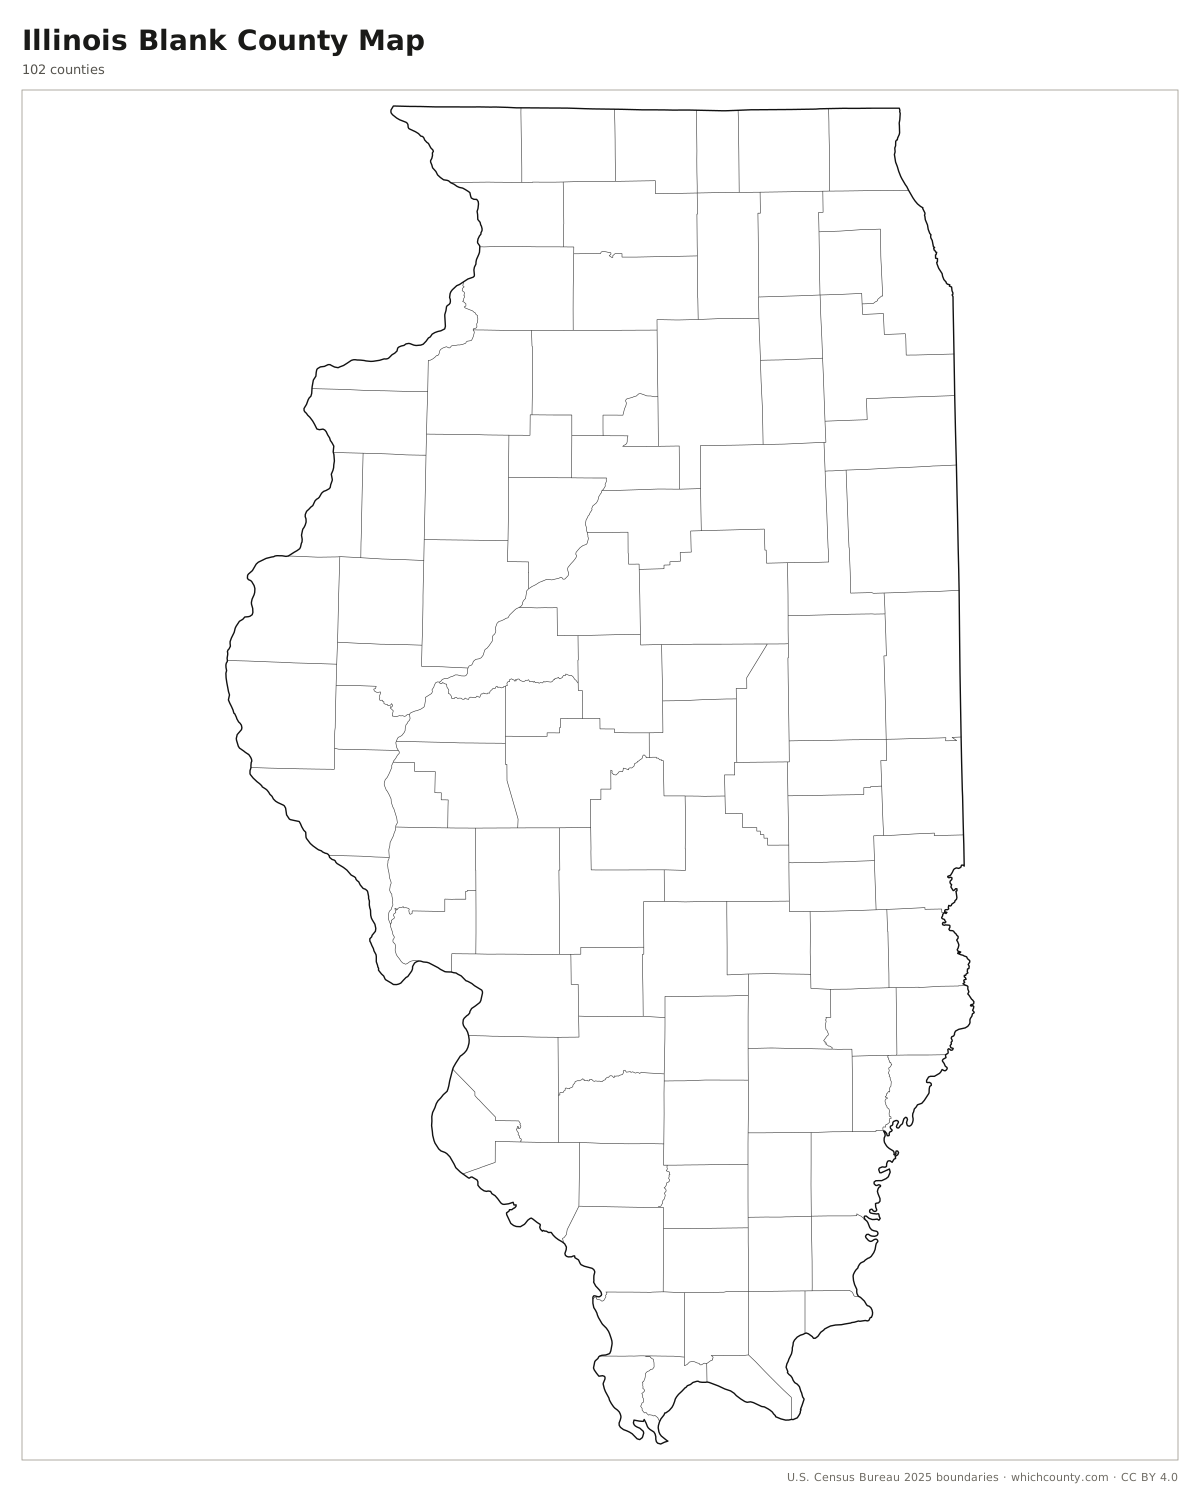
County lines only, no names. For quizzes, coloring and your own notes.
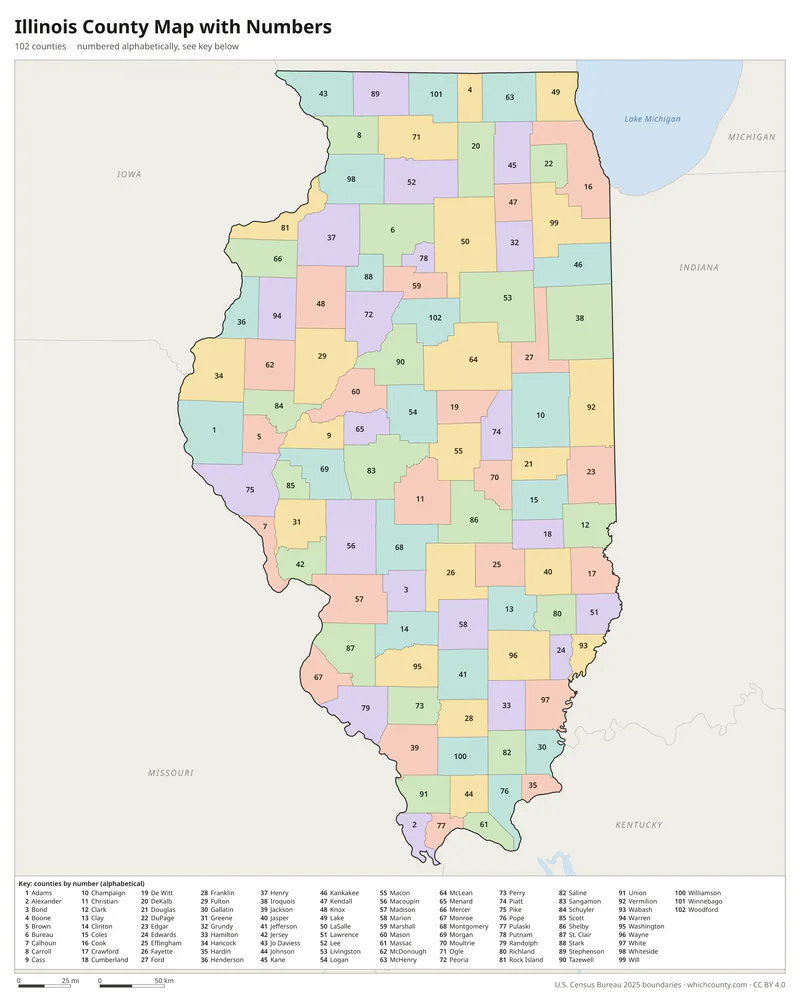
Numbered map with key
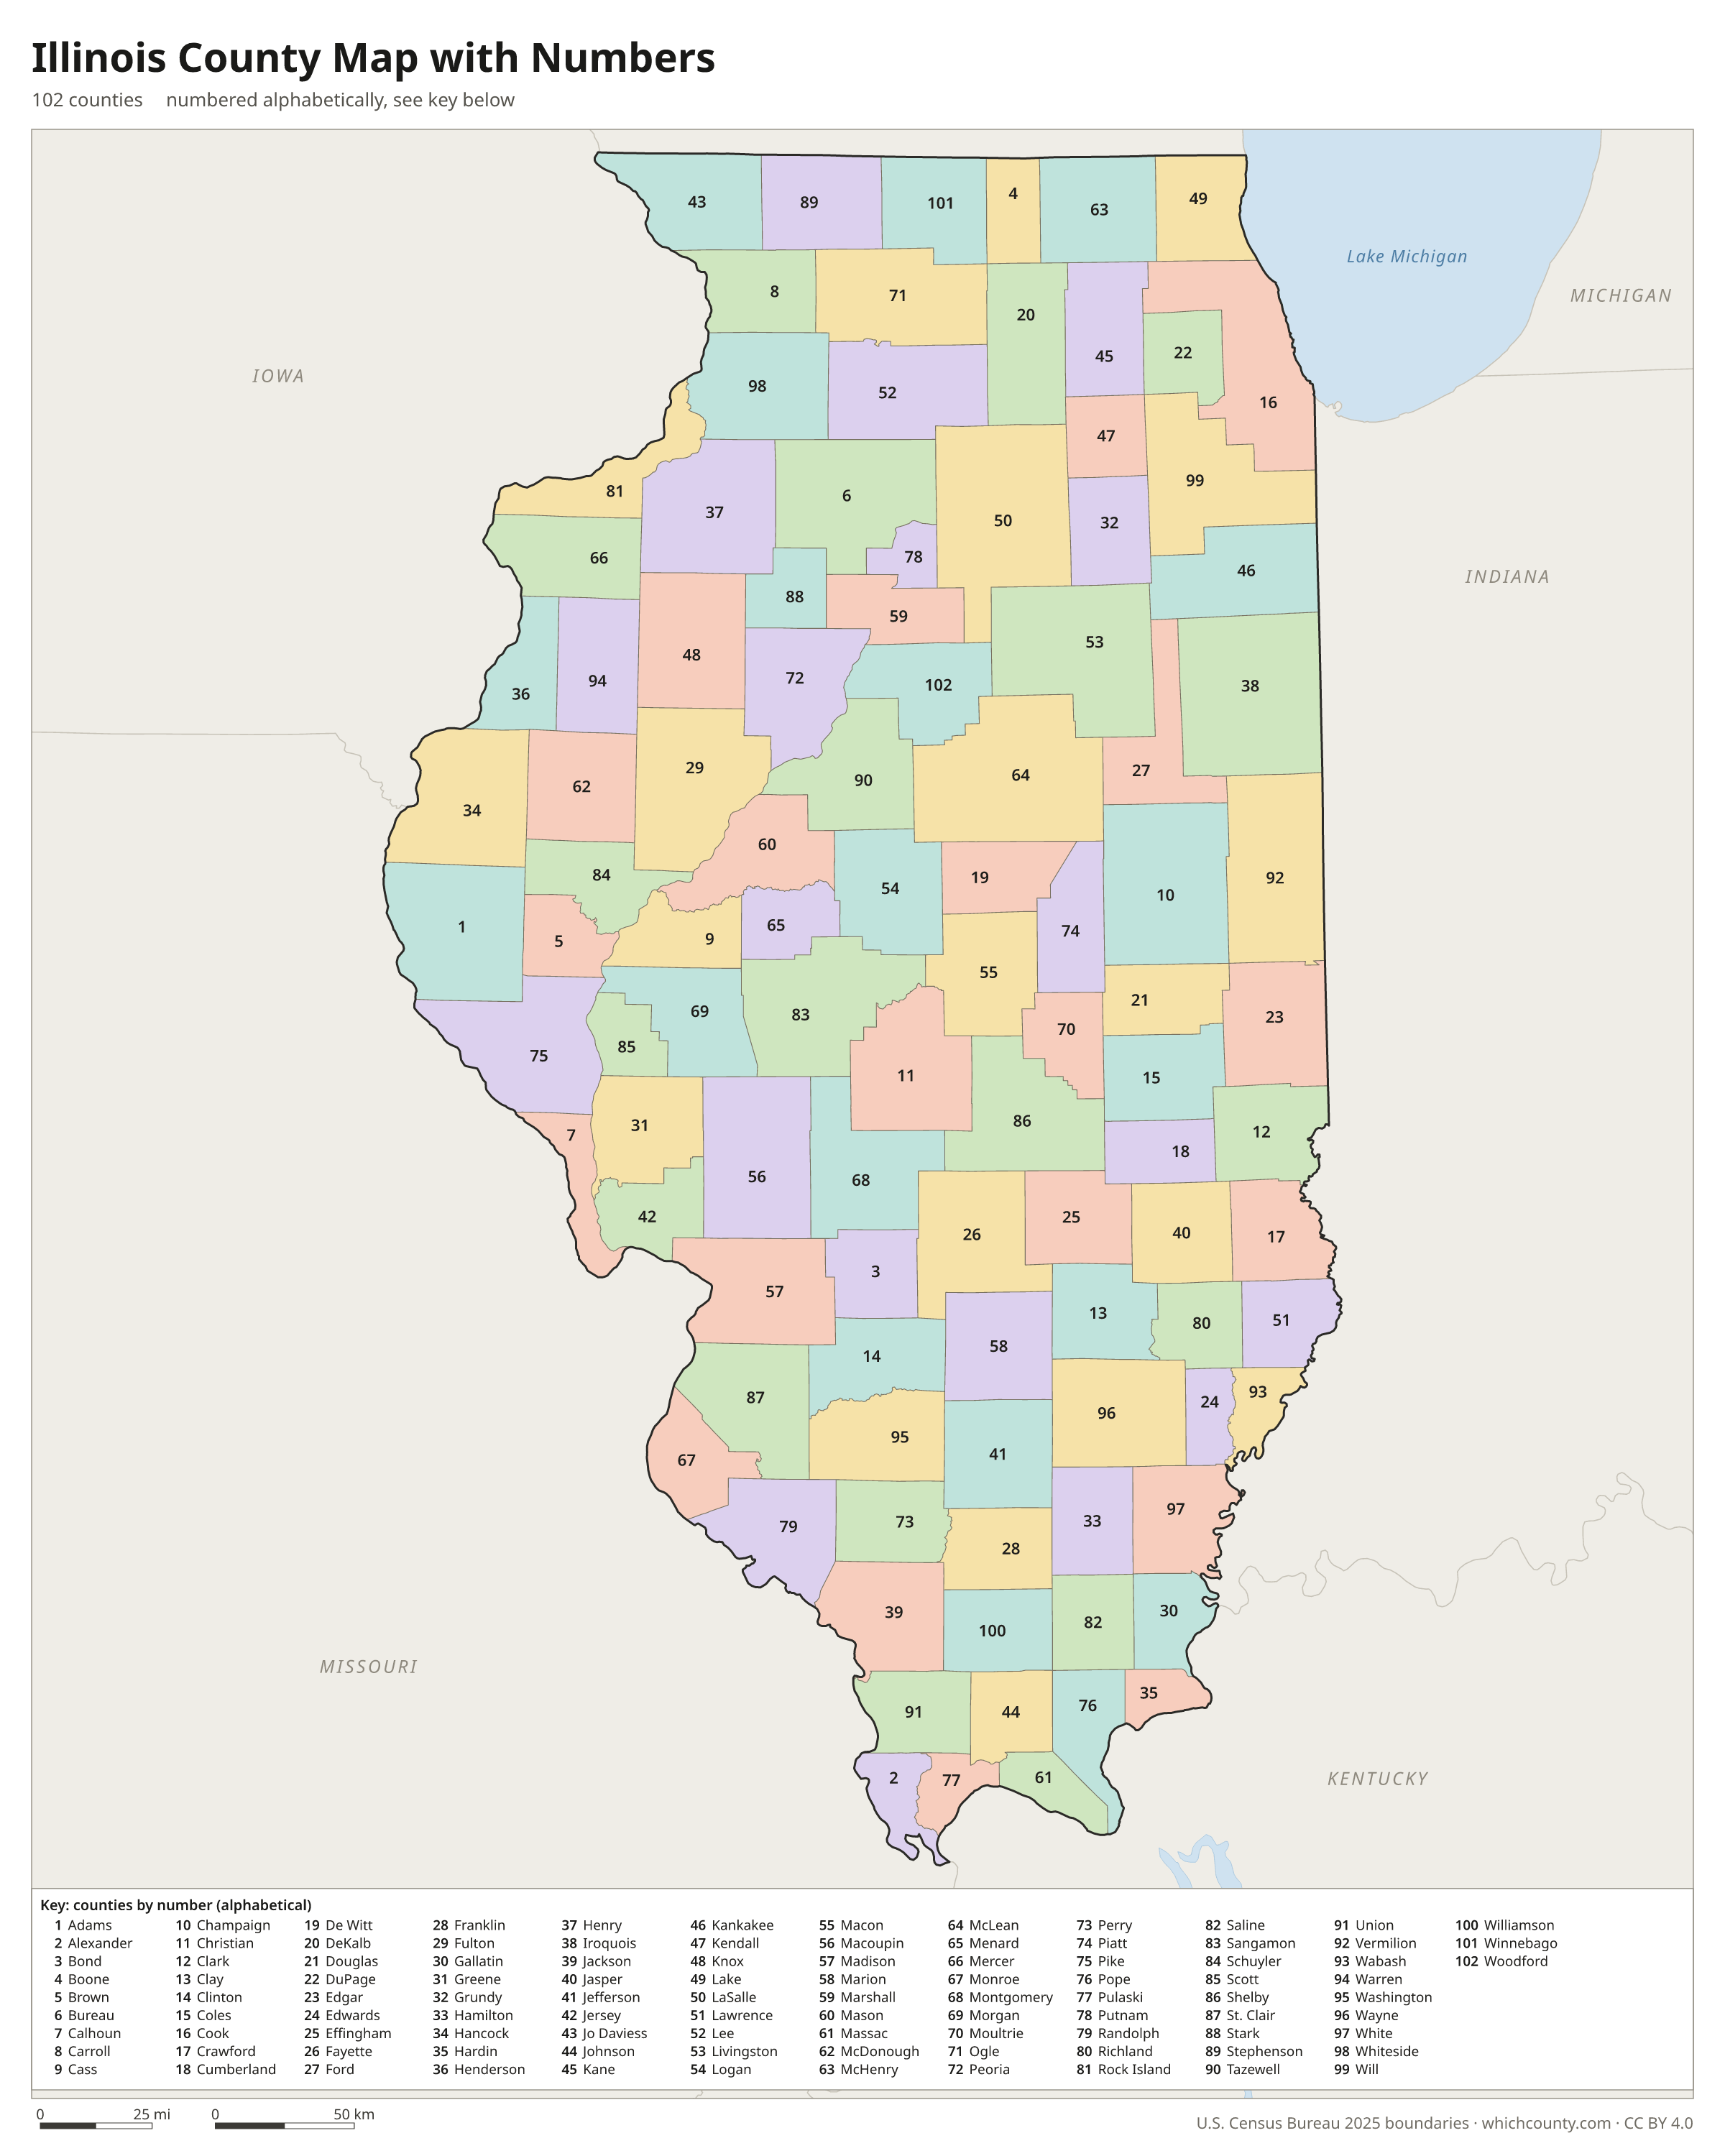
A number in every county with an alphabetical key.
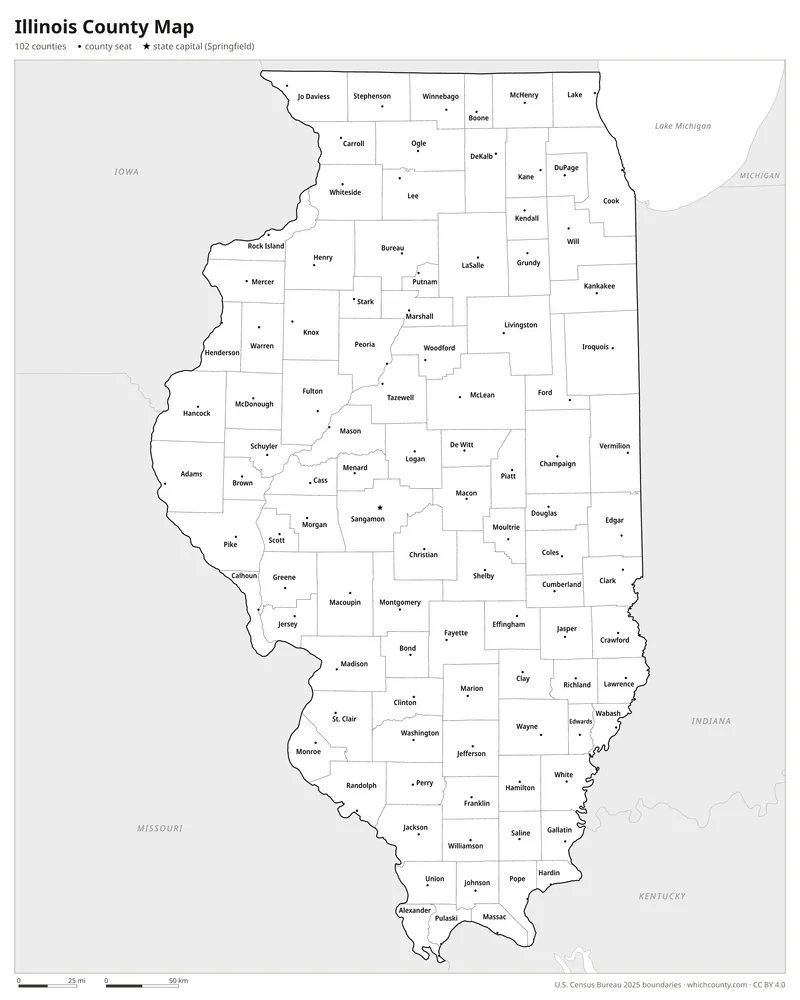
Black and white
Labeled map that prints well on any printer.
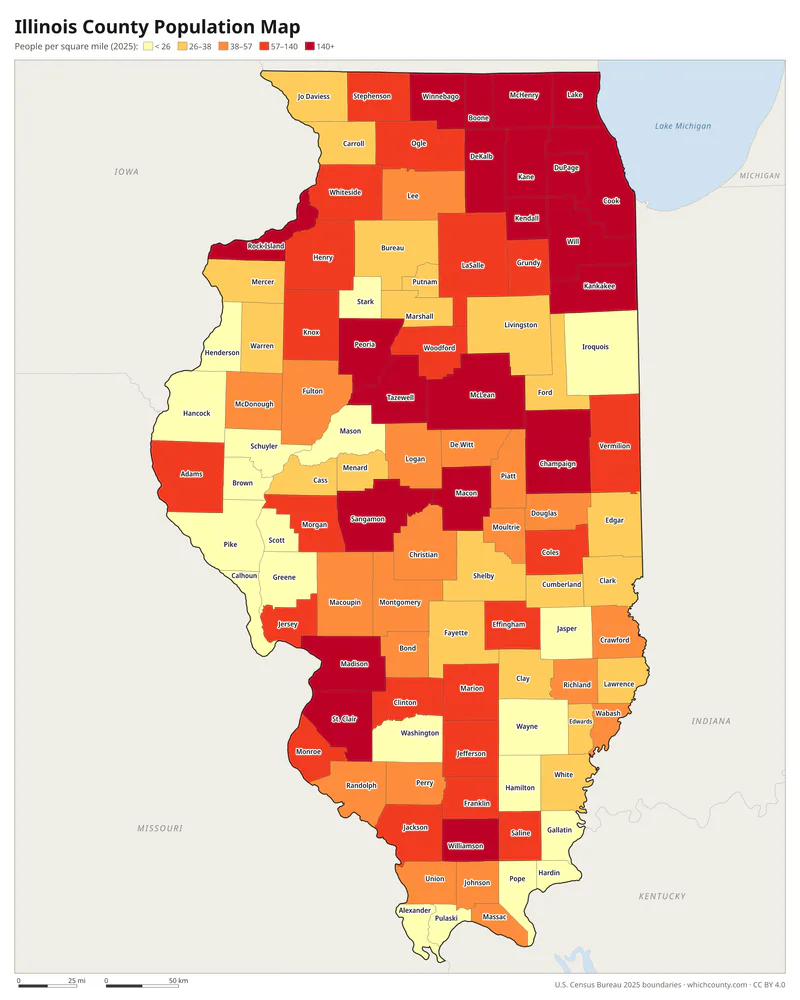
Population map
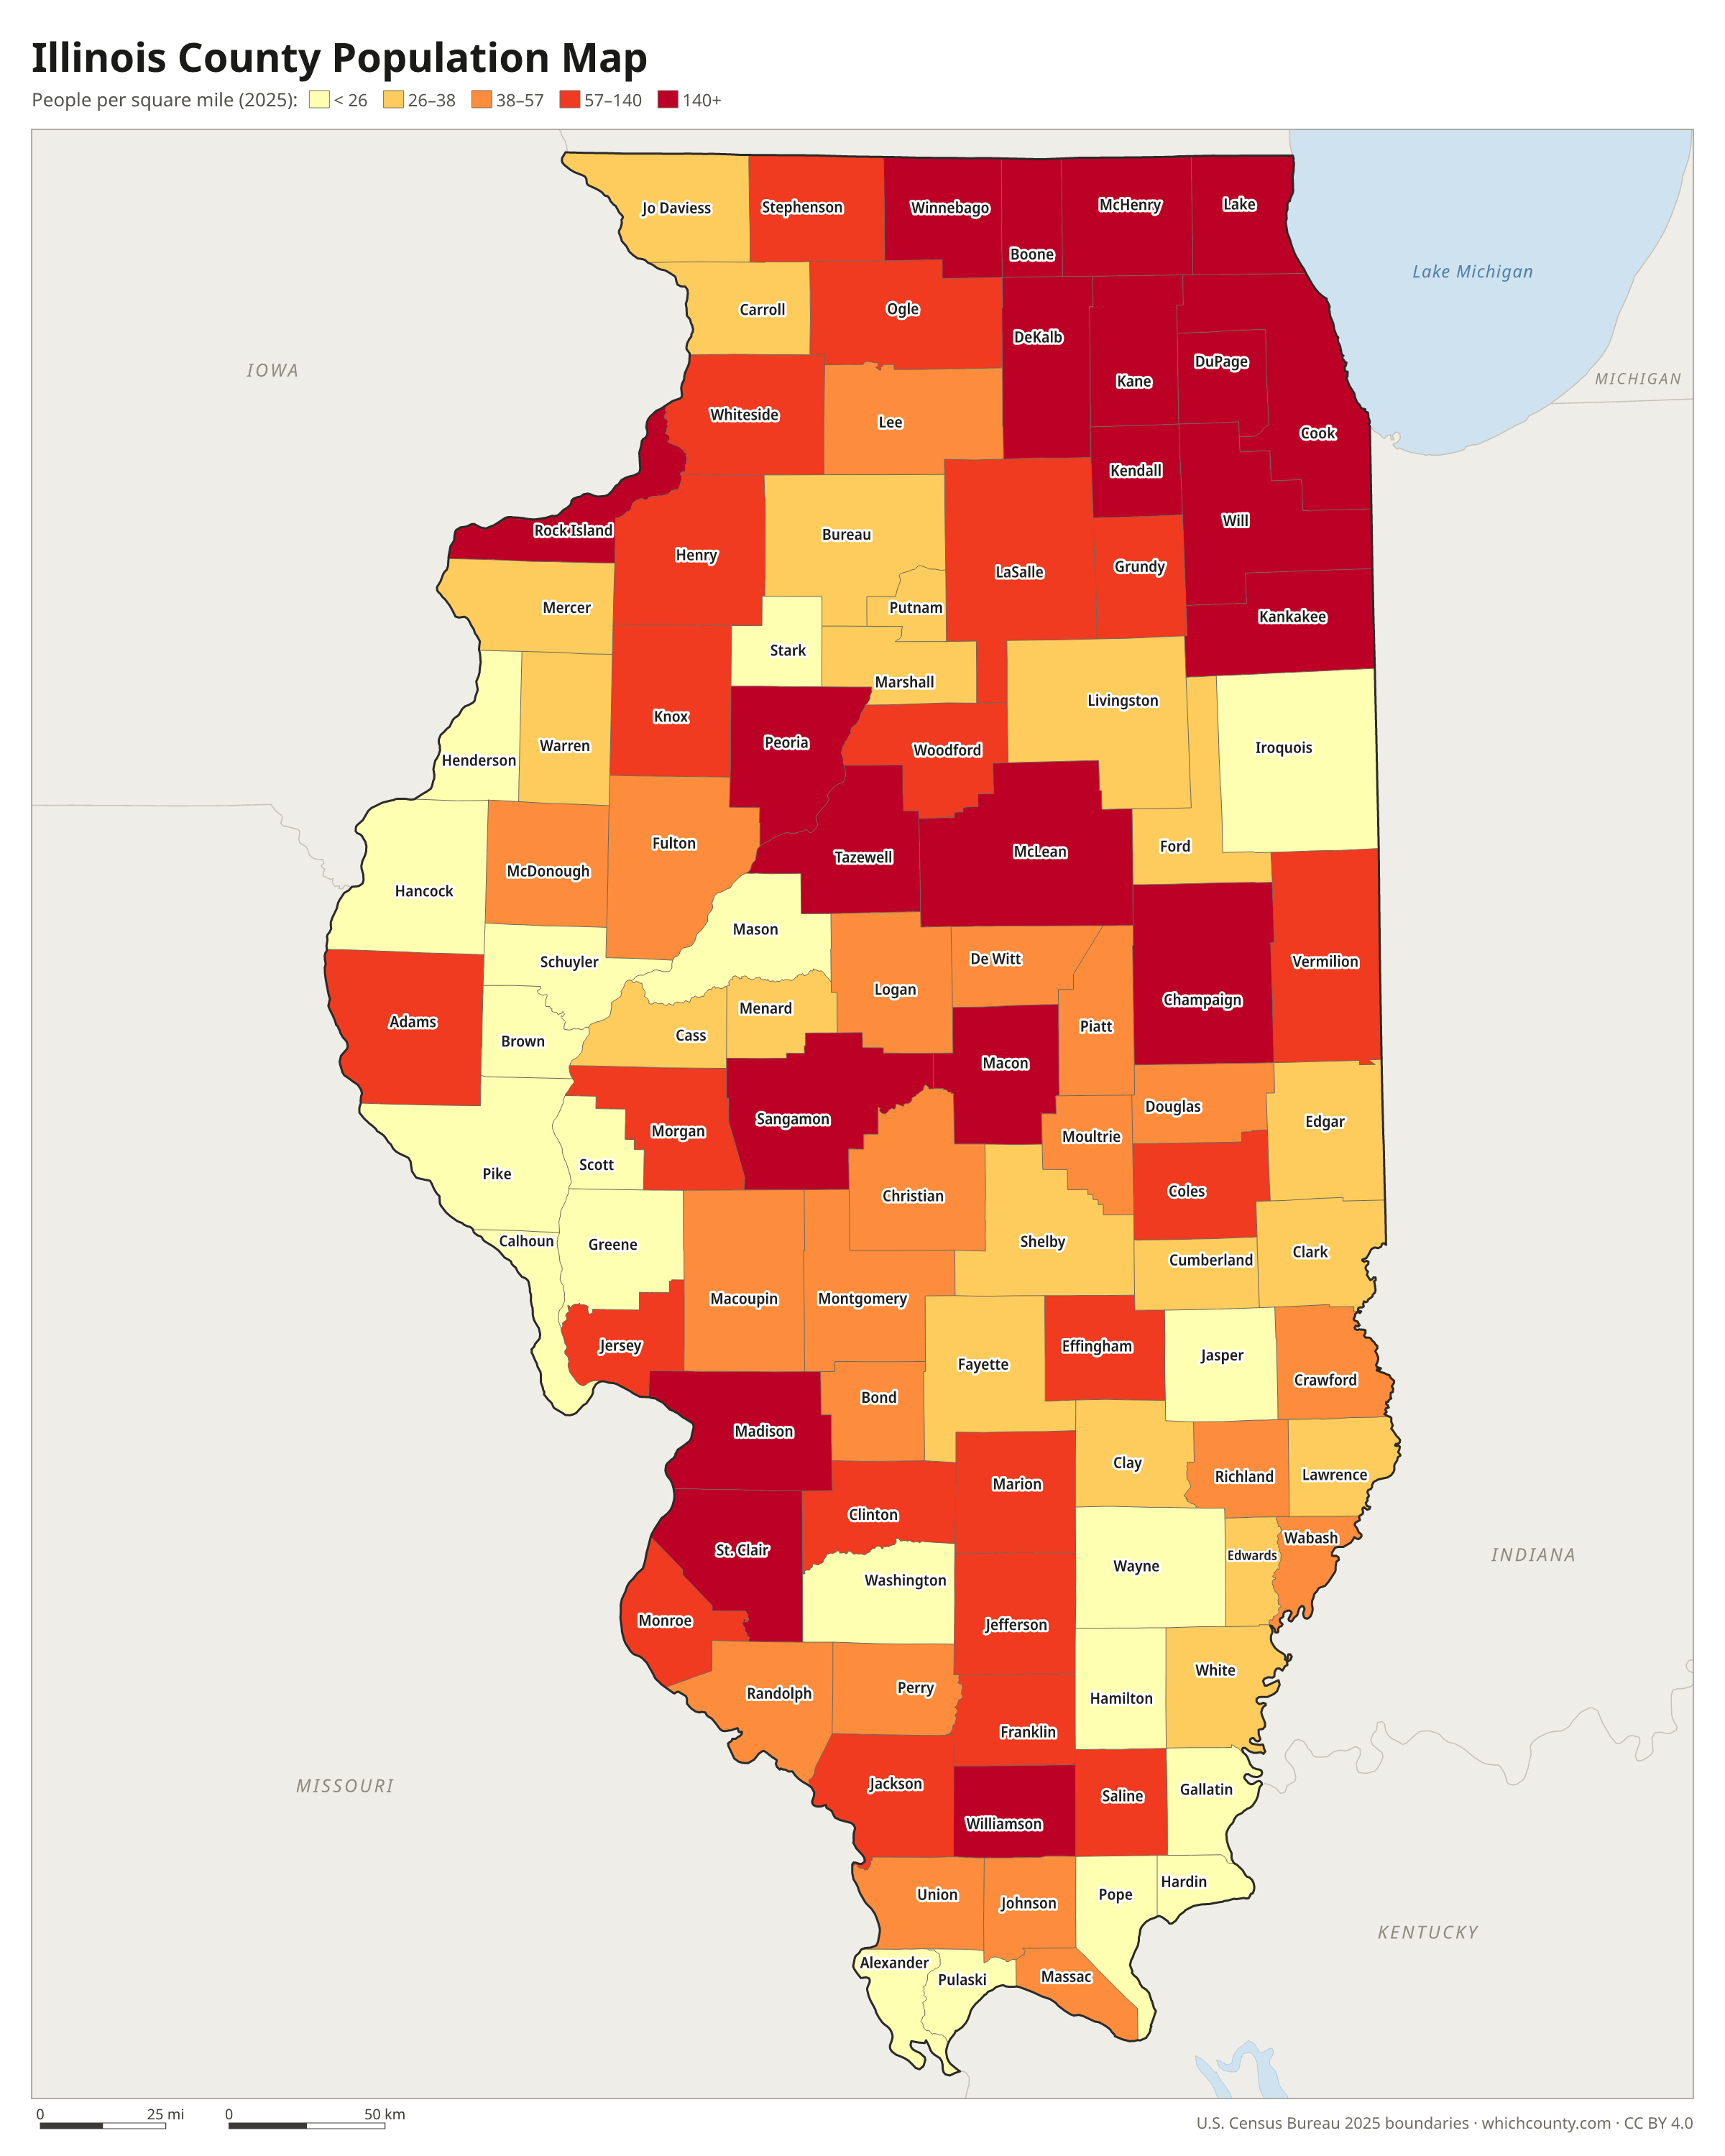
Counties shaded by population density (2025 estimates).
Data and GIS files
The county table as CSV, and the boundaries as GeoJSON and KML (Google Earth, Google My Maps).
How Illinois got 102 counties
Illinois's first county, St. Clair, was organized by proclamation of Northwest Territory governor Arthur St. Clair on April 27, 1790. Fifteen counties existed when Illinois became a state in 1818. Three of them, Madison, Bond and Crawford, had reached north to the Canadian border until statehood cut them off at the state line. The General Assembly then divided these huge early counties into smaller ones. In 1821 it drew Fayette County around the new capital at Vandalia; it covered nearly 7,000 square miles and included parts of 18 present-day counties. By the end of 1839 there were 87 counties. Fifteen more followed, ending with Douglas and Ford in 1859. Thirteen other counties, among them Michigan, Coffee and Oregon, were authorized by the legislature but never completed their organization.
Regions of Illinois
Illinois's counties grouped into the 10 Illinois economic development regions (DCEO) (source).
Northern Stateline
Boone, Ogle, Stephenson, Winnebago
Northwest
Bureau, Carroll, Henry, Jo Daviess, LaSalle, Lee, Mercer, Putnam, Rock Island, Whiteside
Northeast
Cook, DeKalb, DuPage, Grundy, Kane, Kankakee, Kendall, Lake, McHenry, Will
North Central
DeWitt, Fulton, Livingston, Marshall, Mason, McLean, Peoria, Stark, Tazewell, Woodford
East Central
Champaign, Douglas, Ford, Iroquois, Piatt, Vermilion
West Central
Adams, Brown, Hancock, Henderson, Knox, McDonough, Pike, Schuyler, Warren
Central
Cass, Christian, Greene, Logan, Macon, Macoupin, Menard, Montgomery, Morgan, Sangamon, Scott, Shelby
Southeast
Clark, Clay, Coles, Crawford, Cumberland, Edgar, Effingham, Fayette, Jasper, Lawrence, Marion, Moultrie, Richland
Southwest
Bond, Calhoun, Clinton, Jersey, Madison, Monroe, Randolph, St. Clair, Washington
Southern
Alexander, Edwards, Franklin, Gallatin, Hamilton, Hardin, Jackson, Jefferson, Johnson, Massac, Perry, Pope, Pulaski, Saline, Union, Wabash, Wayne, White, Williamson
County maps of neighboring states
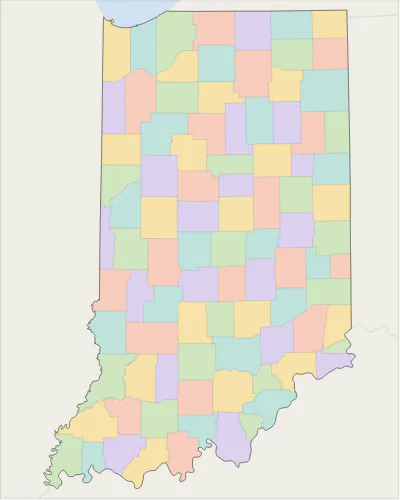 Indiana county map
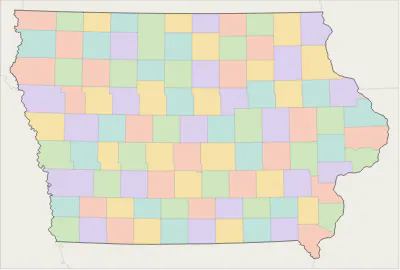 Iowa county map
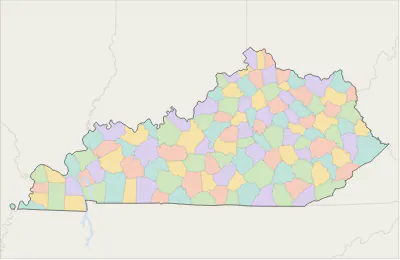 Kentucky county map
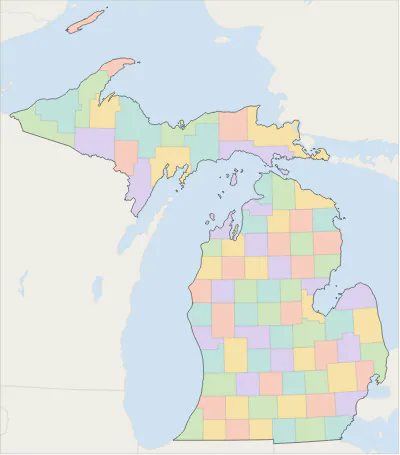 Michigan county map
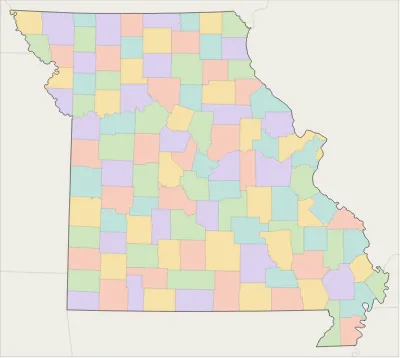 Missouri county map
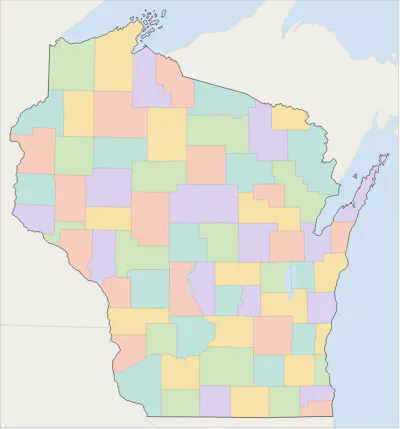 Wisconsin county map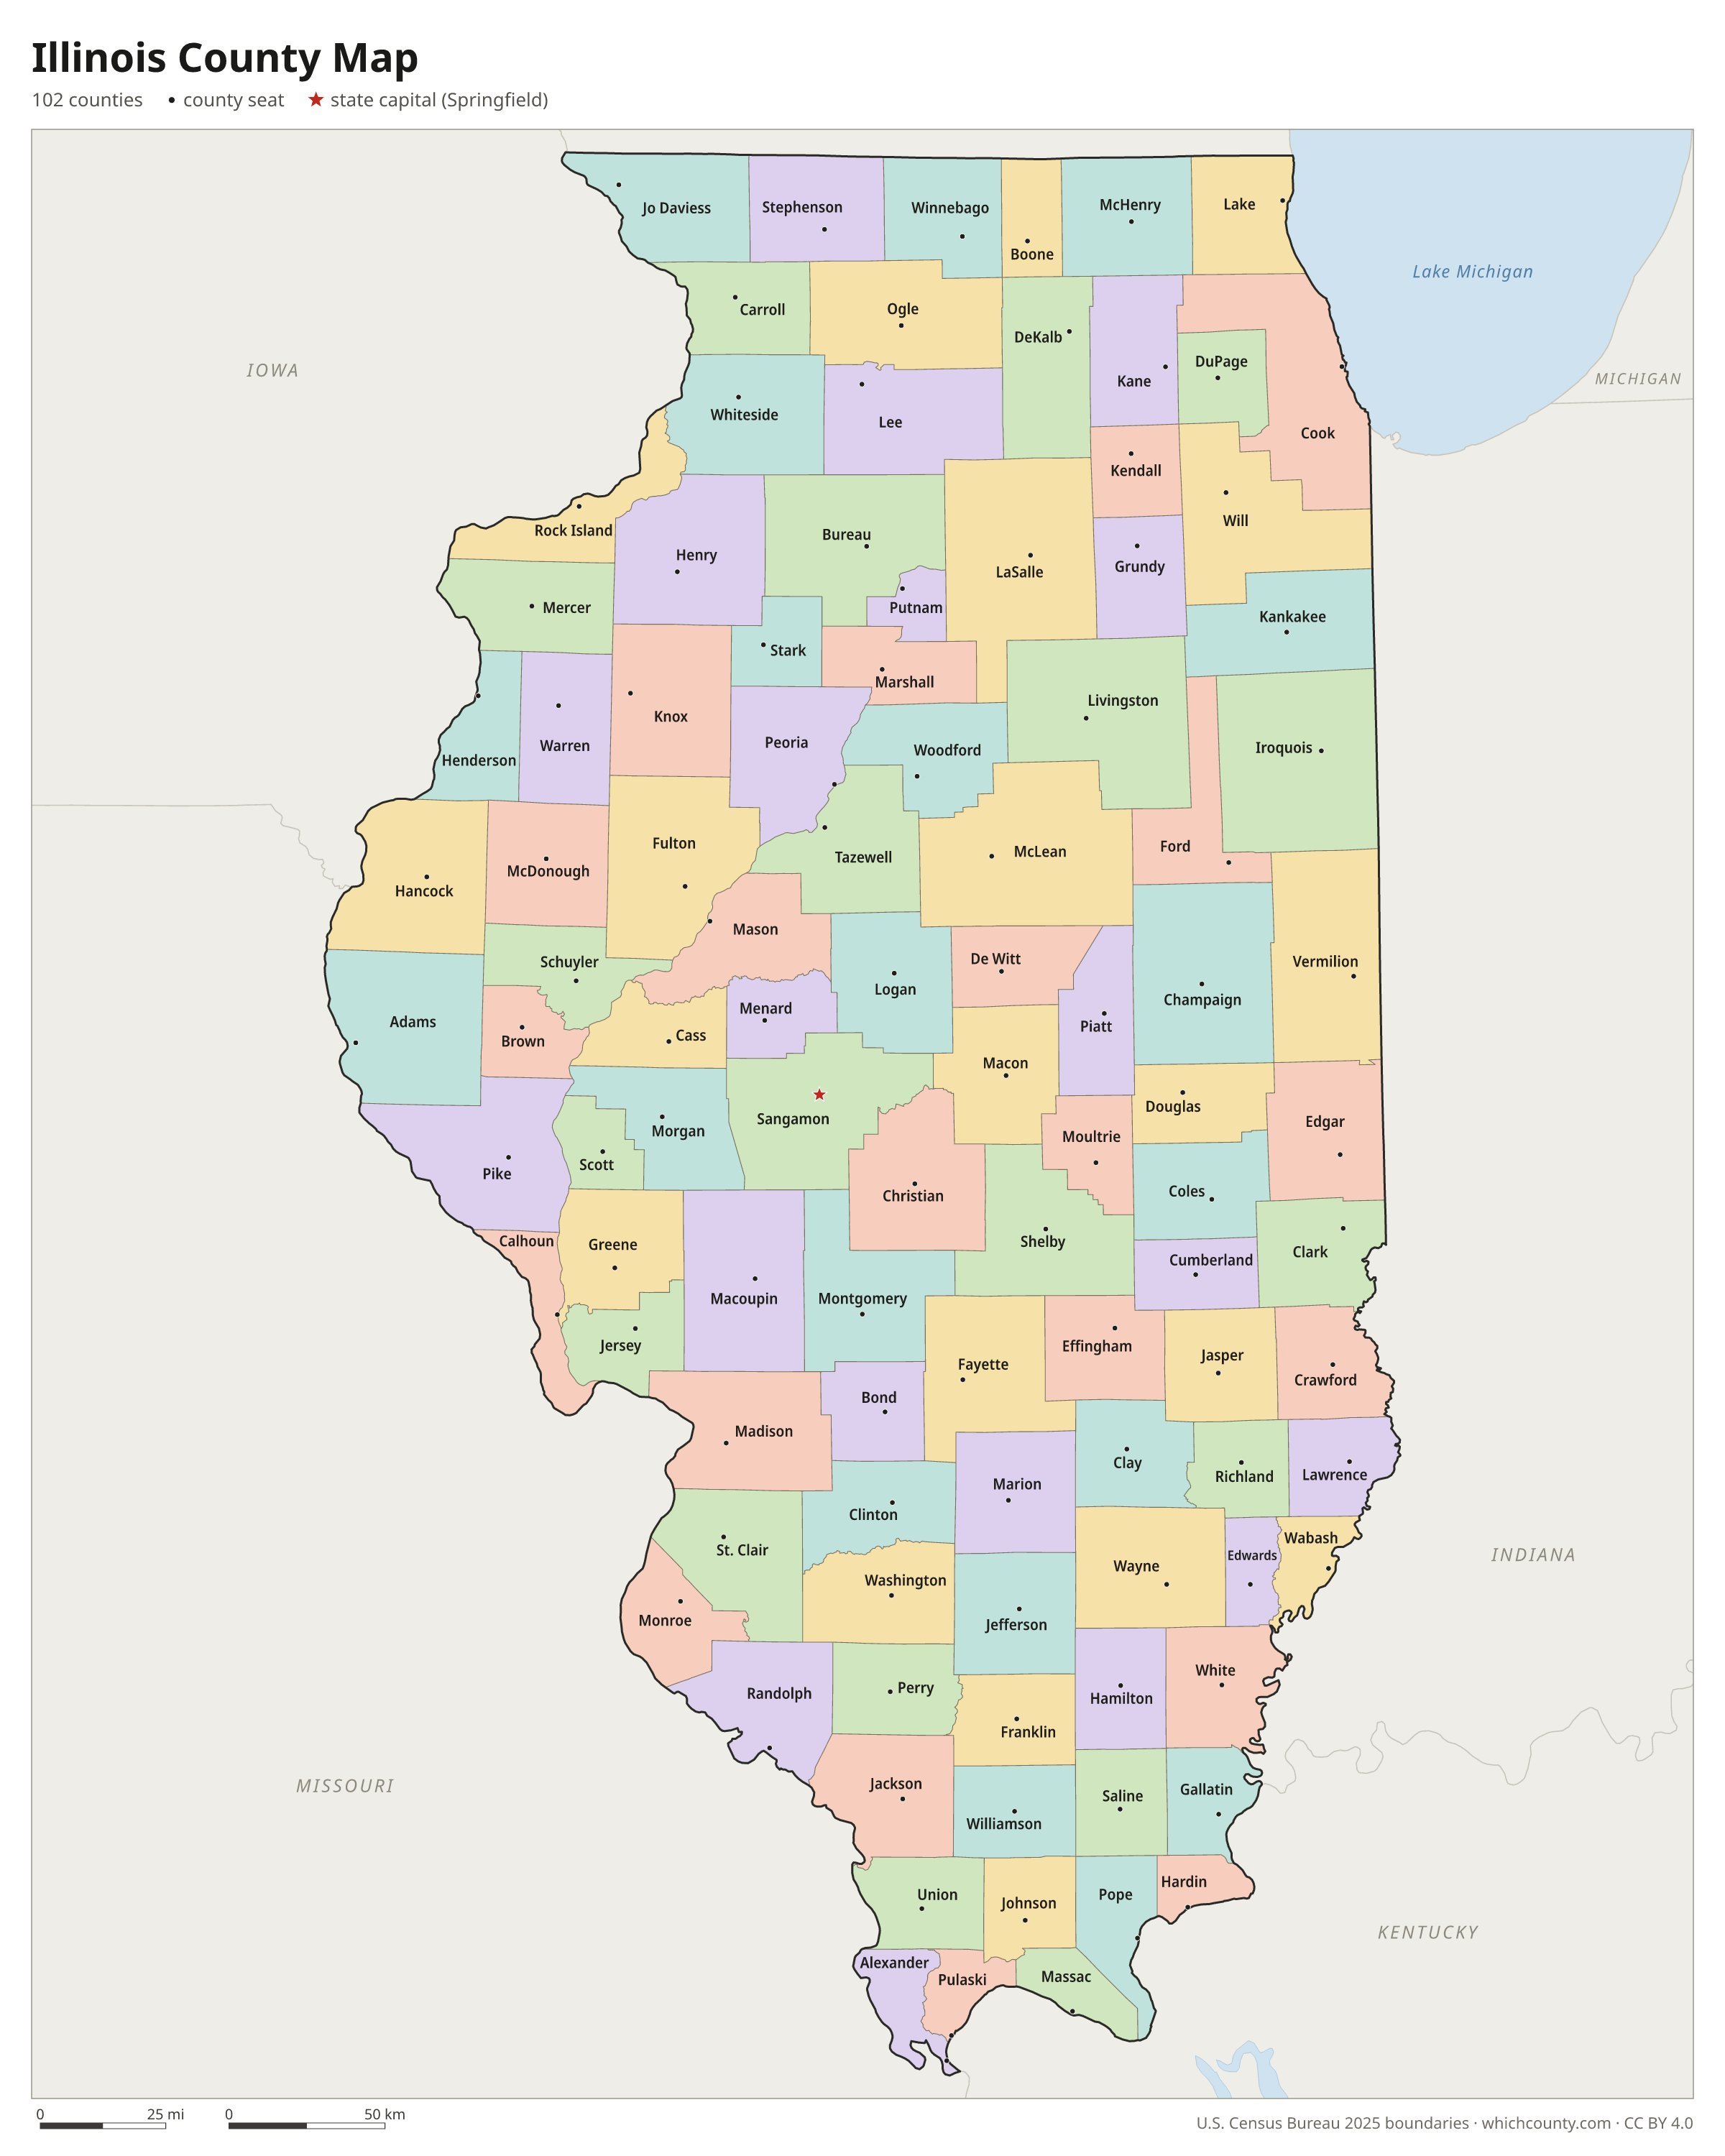
Illinois counties: questions and answers
- How many counties are in Illinois?
- Illinois has 102 counties.
- What is the largest county in Illinois?
- By land area, McLean County is the largest (1,183 sq mi). By population, Cook County is the largest, with 5,194,625 people (2025 estimate).
- What is the smallest county in Illinois?
- Putnam County is the smallest by land area (160.1 sq mi). Hardin County has the fewest people: 3,588 (2025 estimate).
- What is the wealthiest county in Illinois?
- By median household income, DuPage County ranks first with $112,096 (American Community Survey 2020–2024). The lowest is Pulaski County at $42,463.
- What county is Chicago in?
- Chicago is mostly in Cook County, with smaller parts in DuPage County.
- What county is Aurora in?
- Aurora is mostly in Kane County, with smaller parts in DuPage, Will and Kendall counties.
- What county is Naperville in?
- Naperville is mostly in DuPage County, with smaller parts in Will County.
- What county is Springfield in?
- Springfield, the state capital, is in Sangamon County.
- How can I see county lines on Google Maps?
- Google Maps does not draw county lines. Download the KML file from the printable maps section above and import it into Google My Maps (Create a new map › Import) or open it in Google Earth to see every Illinois county boundary on top of Google's map.
- Can I use this map for free?
- Yes. The maps and files on this page are free to print, share and use in your own work, including commercial projects, under the CC BY 4.0 licence. Please credit “WhichCounty (whichcounty.com)”.
Use this map on your site
You may copy, print and publish these maps, also commercially, as long as you credit WhichCounty with a link (licence details). Paste this code to embed the map:
Sources and methodology
- Boundaries: U.S. Census Bureau, 2025 Cartographic Boundary Files (1:500,000), simplified for display. Projection: Lambert conformal conic fitted to Illinois.
- Population: Census Bureau county estimates, Vintage 2025 (July 1, 2025), compared with the April 1, 2020 estimates base.
- Land area: Census Bureau 2026 Gazetteer files. Median household income: American Community Survey 2020–2024 5-year estimates.
- County seats and founding years: Wikidata (CC0), checked against state lists by WhichCounty. Cities: Census Bureau city and town estimates, Vintage 2025.
- Origin and Evolution of Illinois Counties (Illinois Secretary of State)
- Atlas of Historical County Boundaries: Illinois (Newberry Library)
Found an error? Tell us. Last data update: October 4, 2026.