California County Map
All 58 counties with county seats and major cities
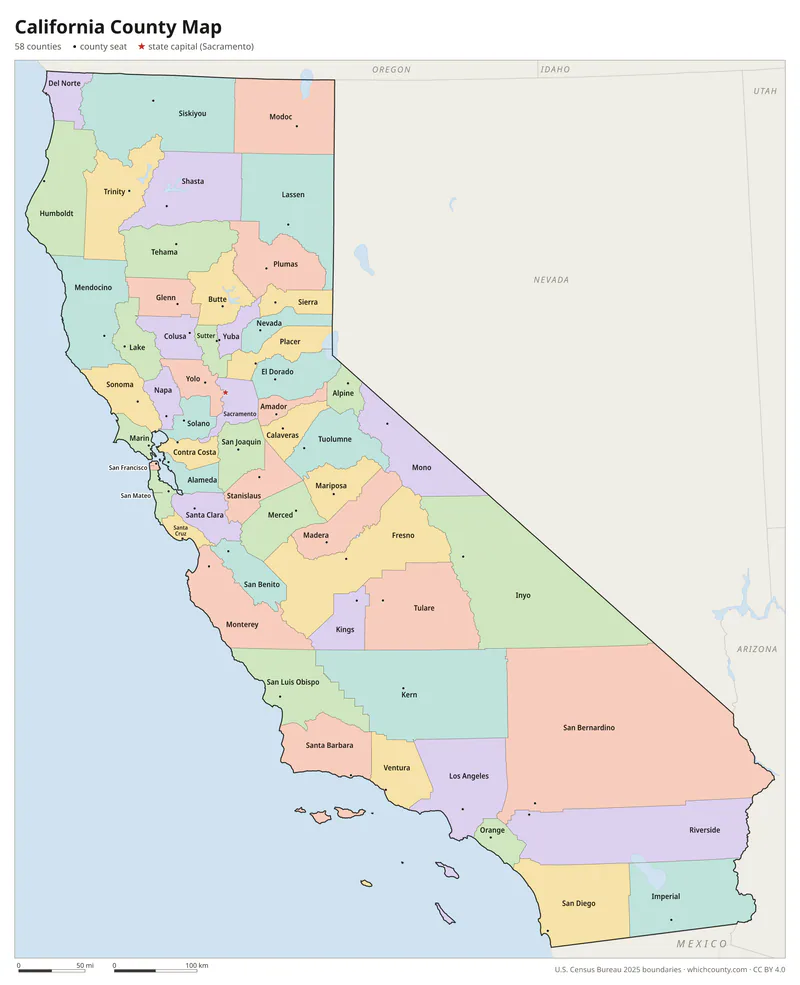
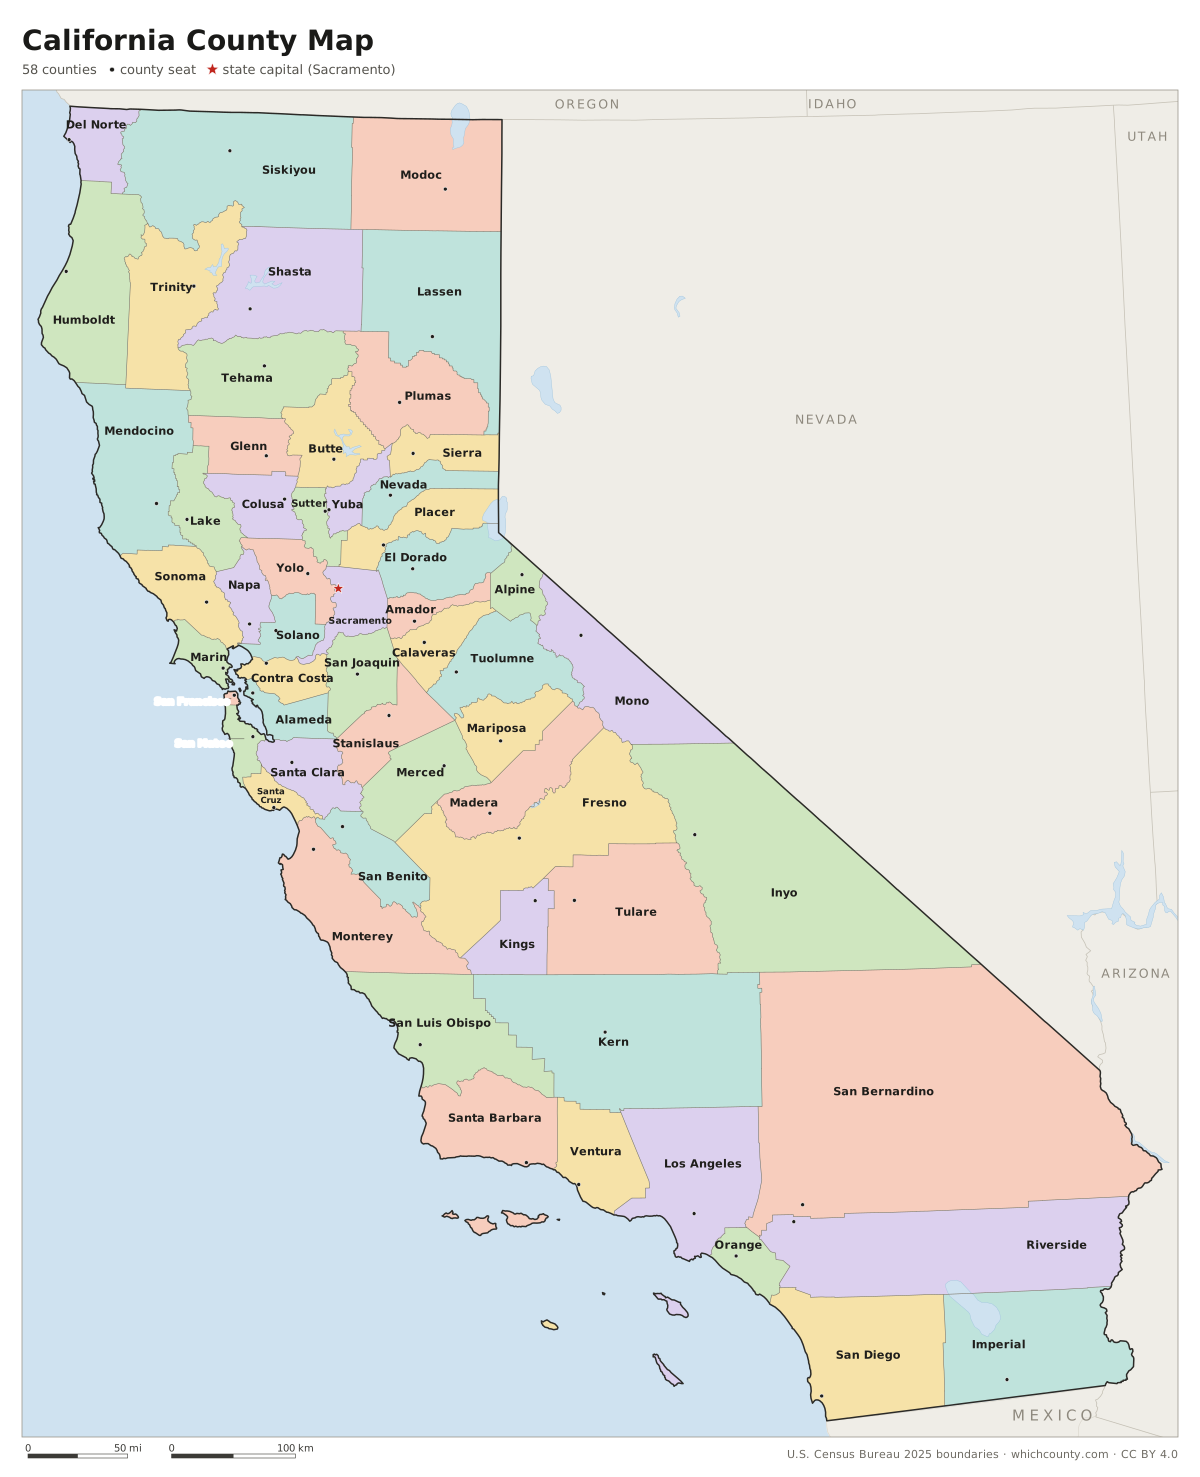
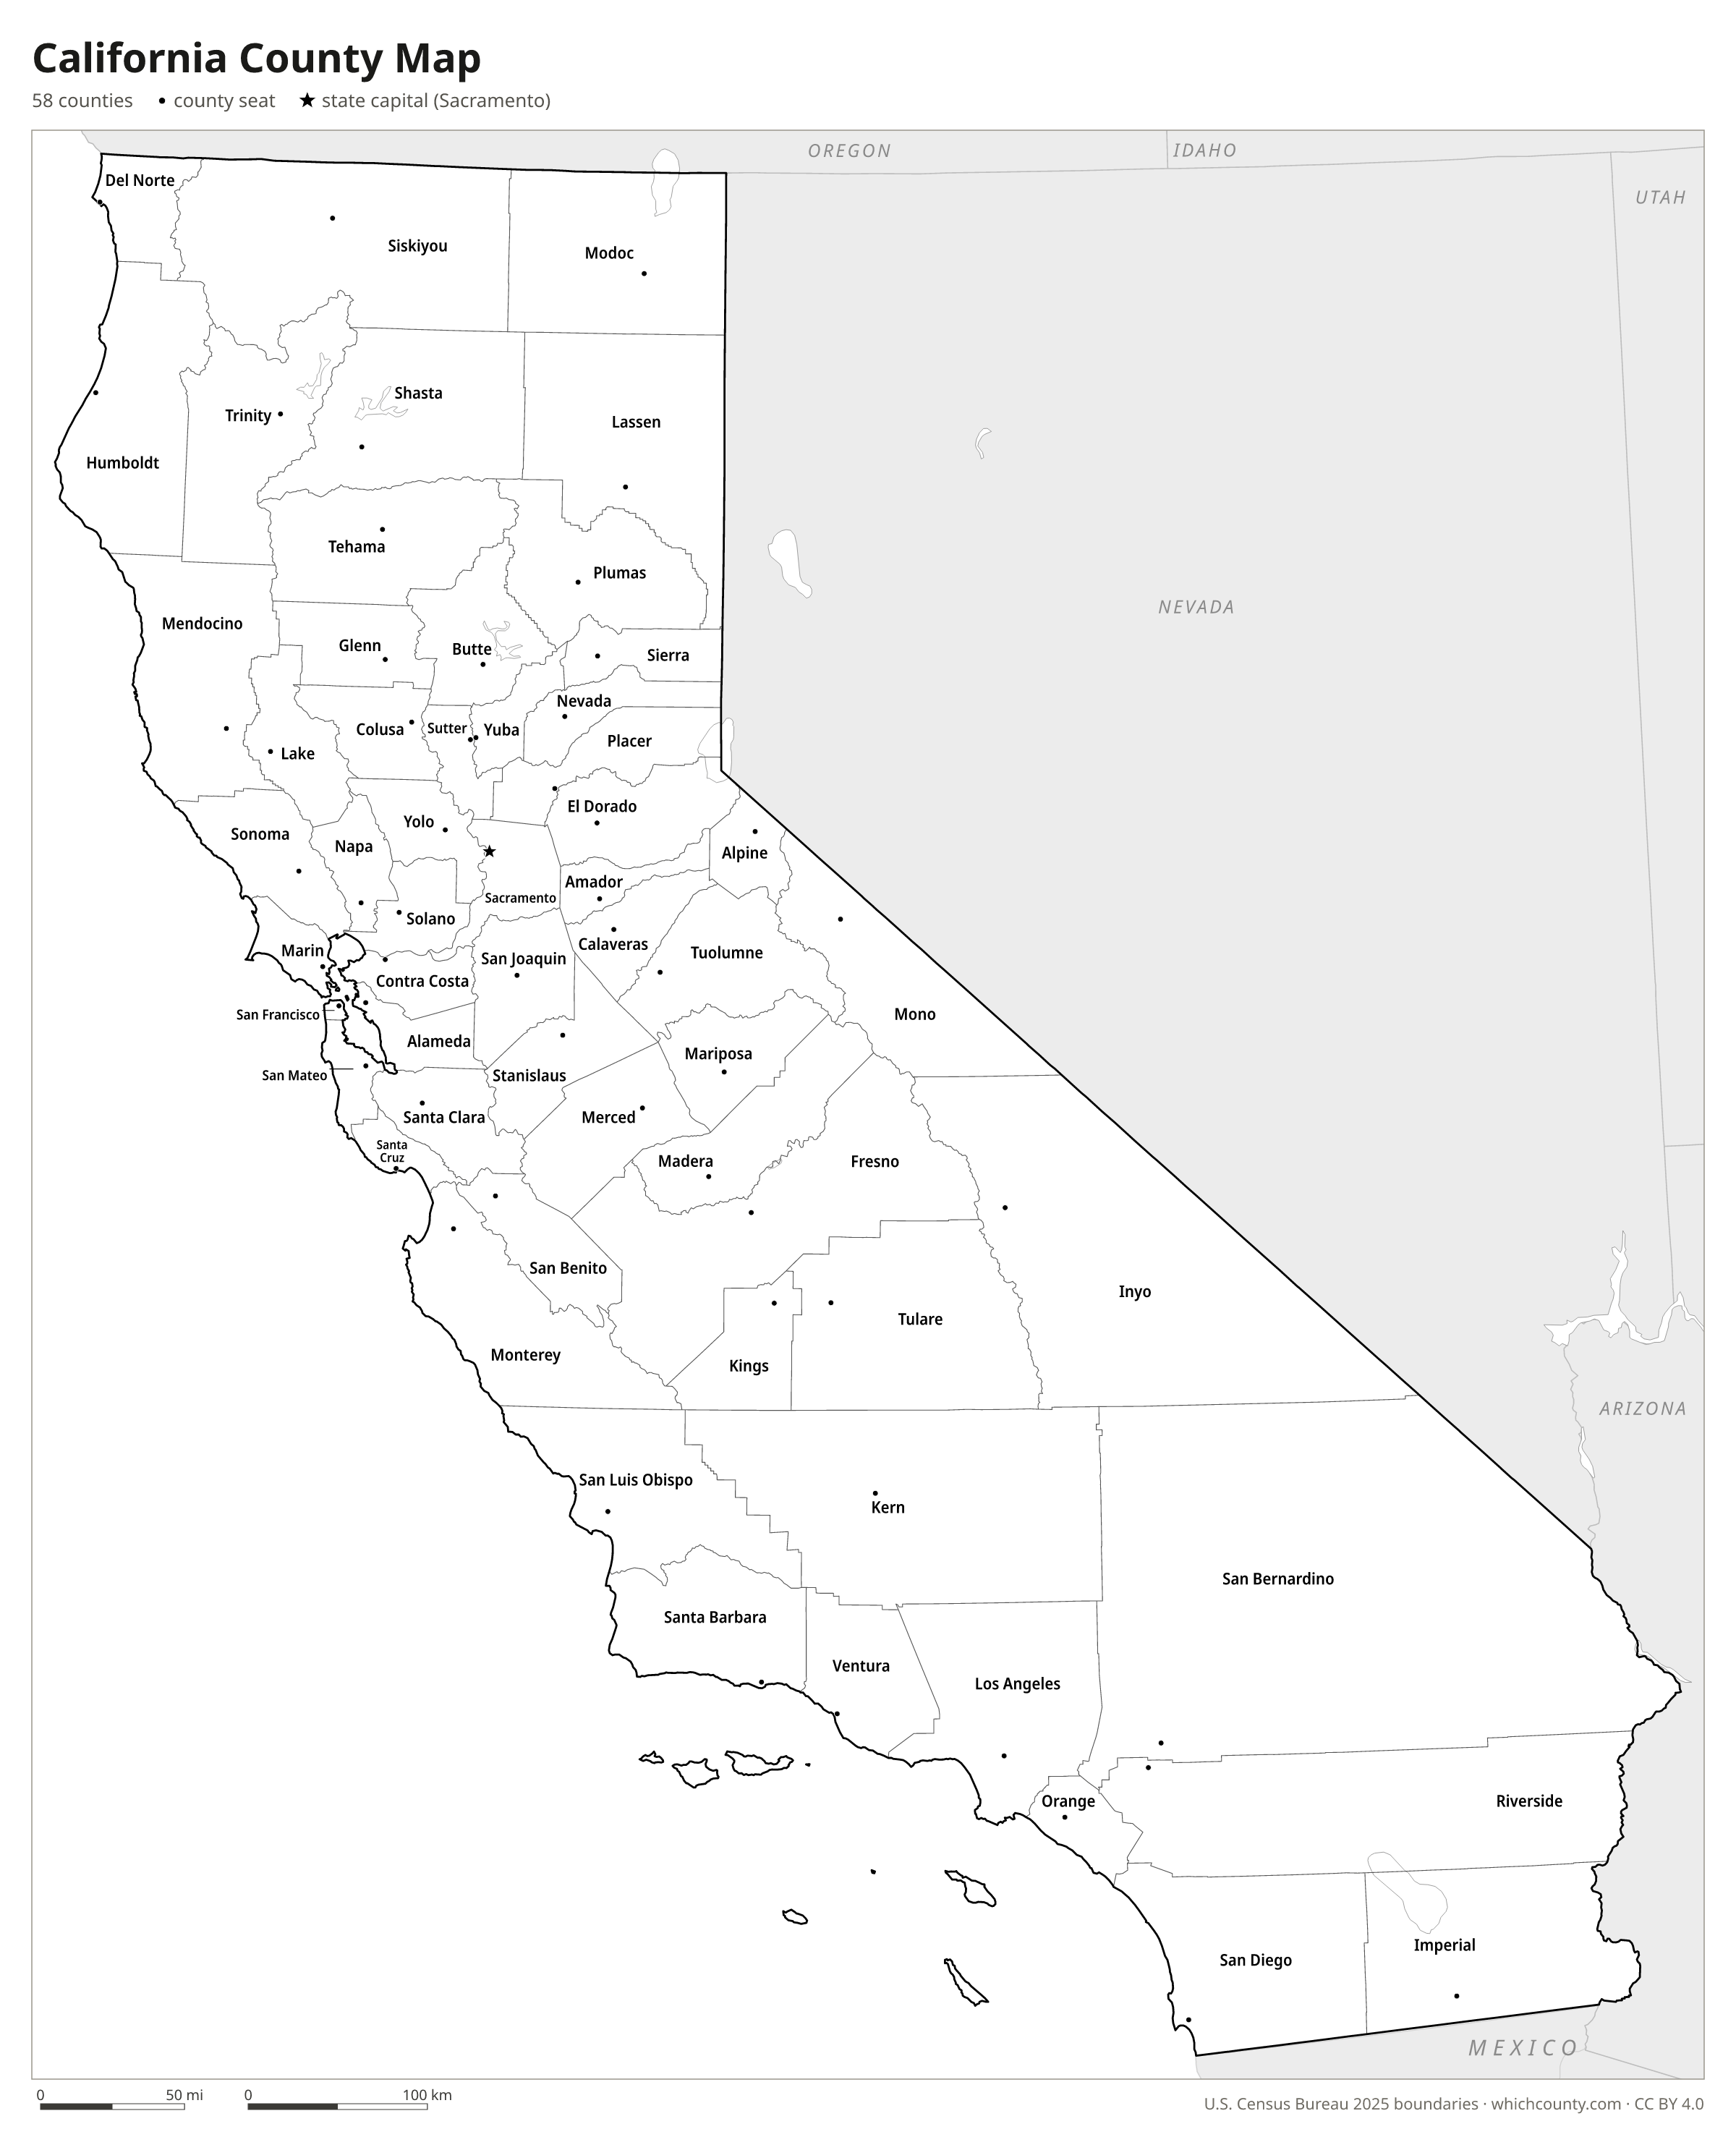
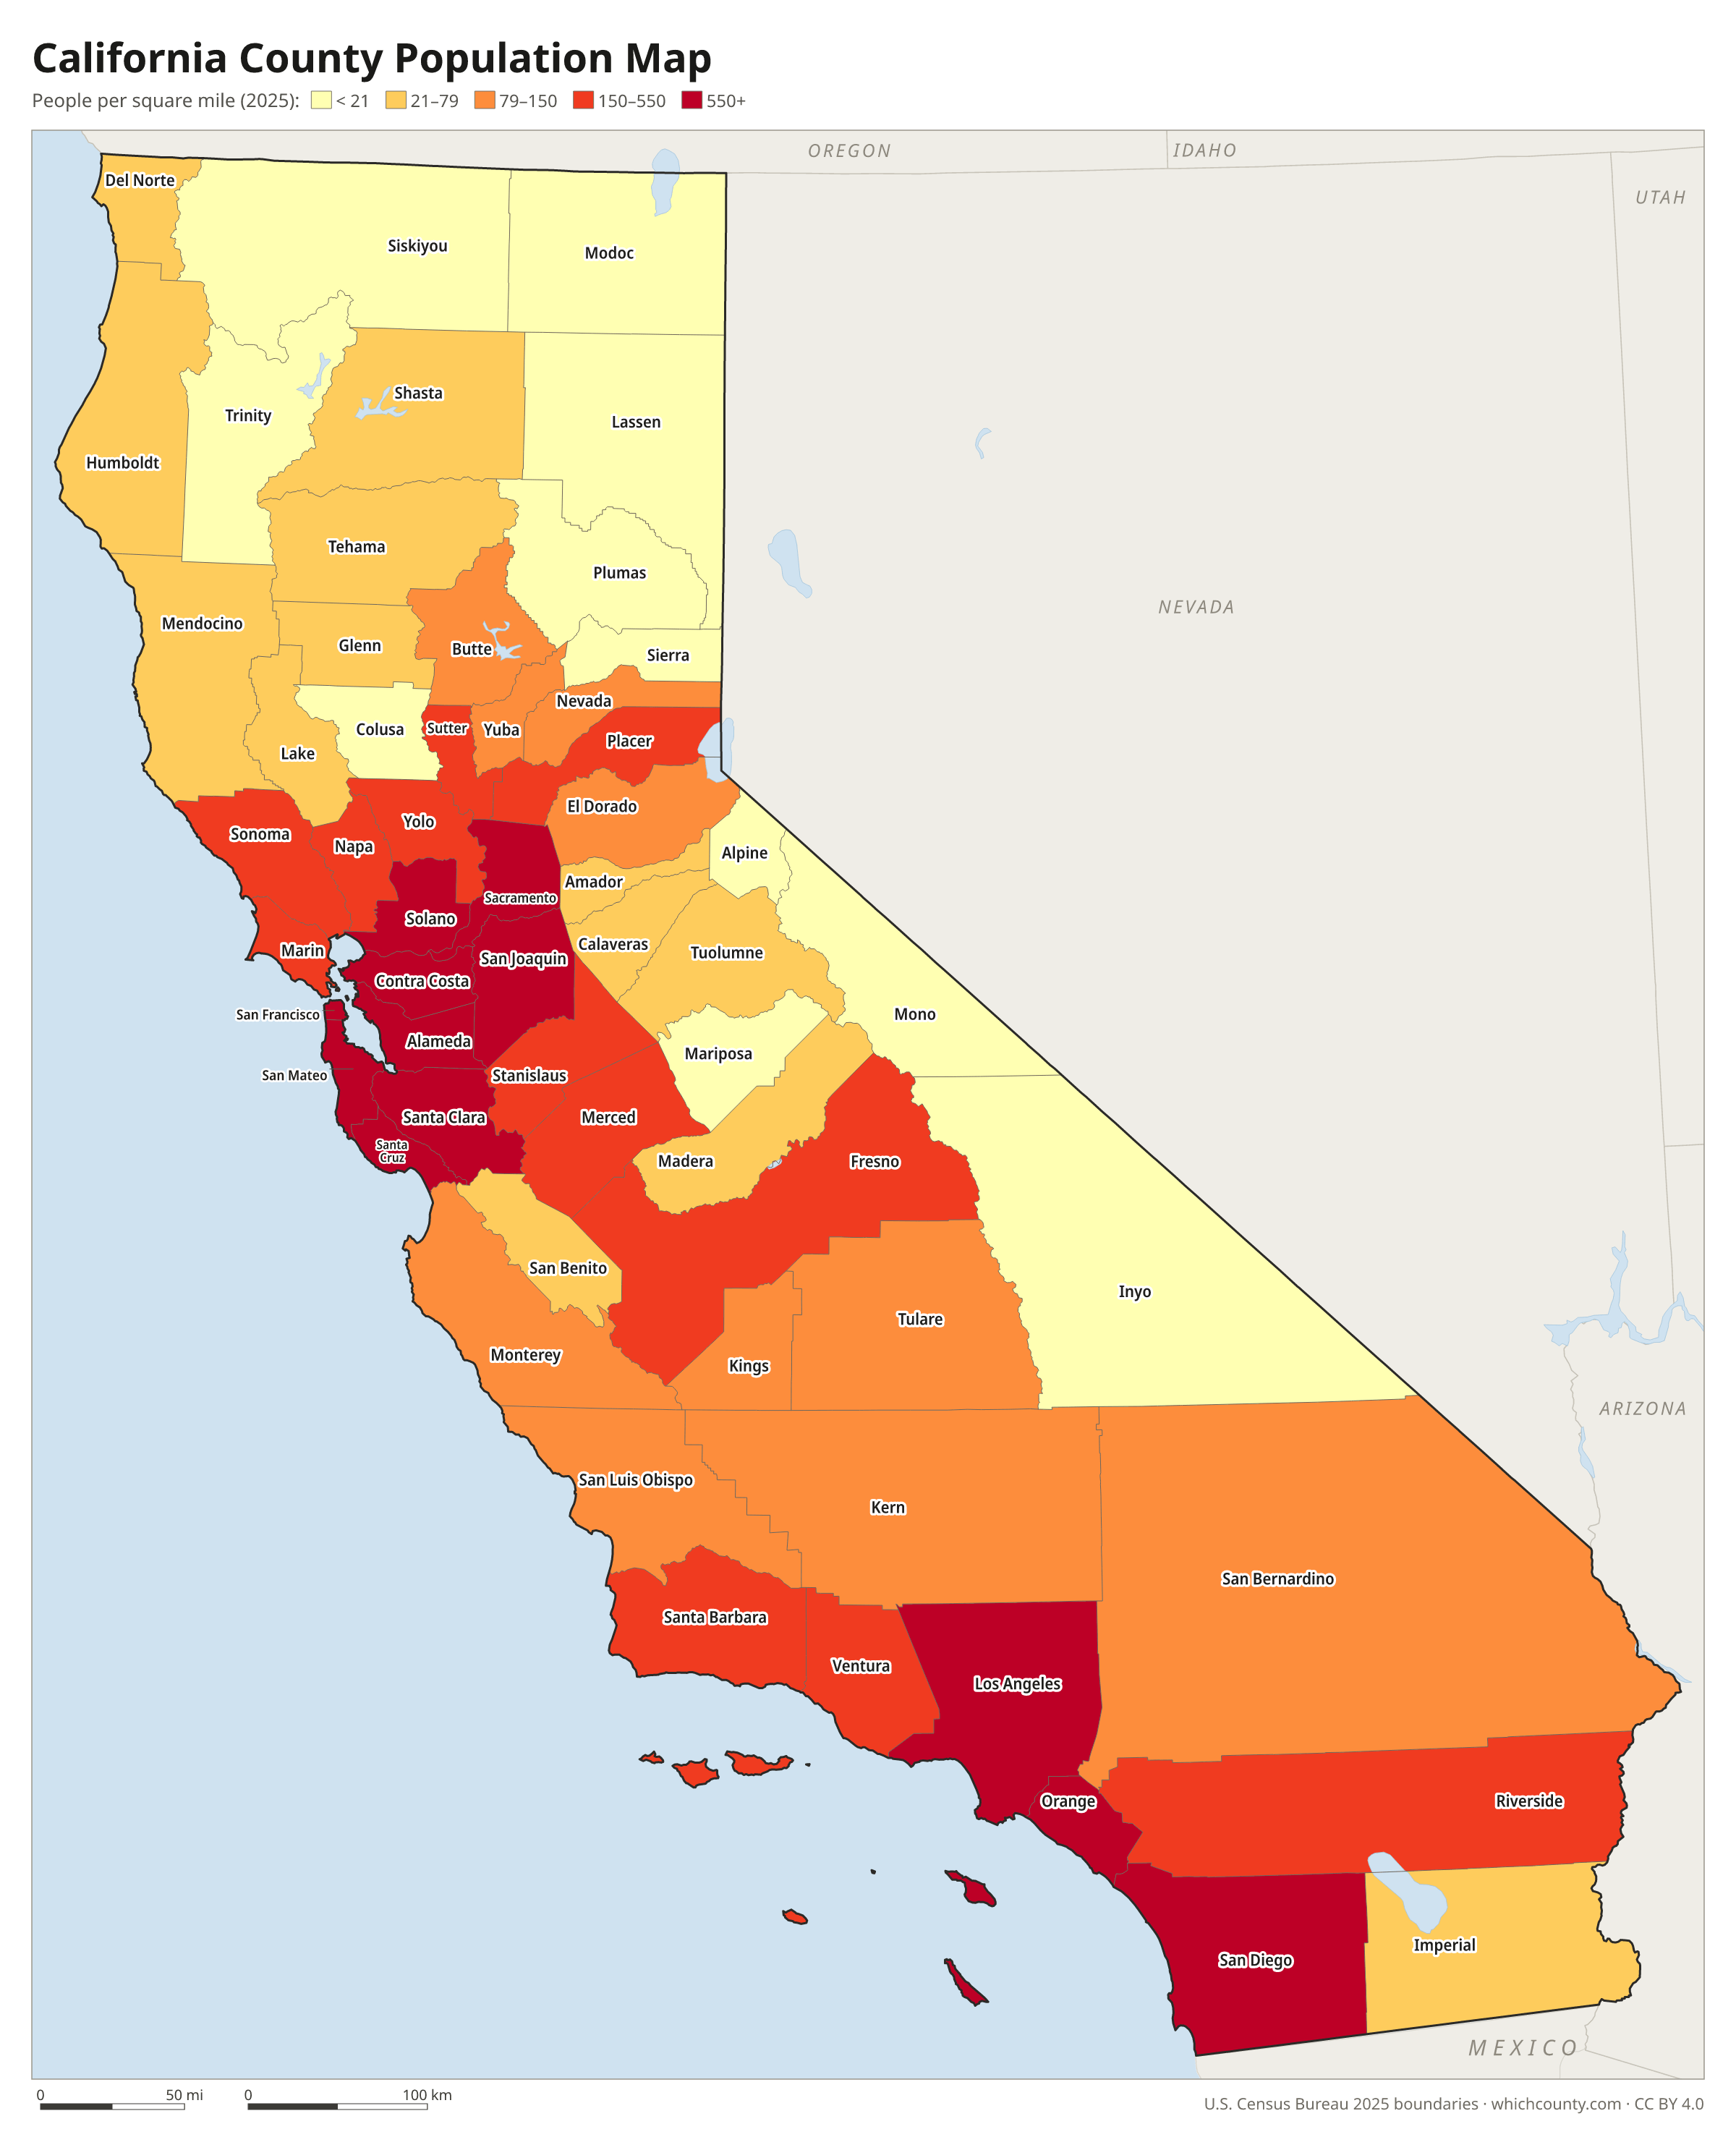
California has 58 counties, from San Bernardino, the largest county by area in the lower 48 states, to San Francisco, which is both a city and a county. This map shows all 58 counties and their county seats. Tap a county for details, or download the free printable map below.

Updated October 4, 2026 · Boundaries: U.S. Census Bureau 2025 · Population: Census estimates for July 1, 2025
California county facts
- Number of counties
- 58
- Largest by land area
- San Bernardino County 20,068 sq mi
- Smallest by land area
- San Francisco County 46.7 sq mi
- Most people
- Los Angeles County 9,694,934
- Fewest people
- Alpine County 1,043
- Fastest growing since 2020
- Placer County +9.2%
- Highest median household income
- Santa Clara County $164,281
- Oldest county
- Butte County est. 1850
- Newest county
- Imperial County est. 1907
- State capital
- Sacramento Sacramento County
San Francisco is a consolidated city and county.
List of 58 California counties
Sorted A–Z. Click a column to sort, or a name to show it on the map. Download as CSV
| County | County seat | Population 2025 | Change since 2020 | Land area (sq mi) | Median income | Established | FIPS |
|---|---|---|---|---|---|---|---|
| Alameda County | Oakland | 1,636,630 | −2.7% | 738 | $129,367 | 1853 | 06001 |
| Alpine County | Markleeville | 1,043 | −11.5% | 738 | $105,521 | 1864 | 06003 |
| Amador County | Jackson | 41,876 | +3.4% | 595 | $88,044 | 1854 | 06005 |
| Butte County | Oroville | 209,211 | −1.1% | 1,637 | $67,928 | 1850 | 06007 |
| Calaveras County | San Andreas | 46,605 | +2.9% | 1,020 | $78,647 | 1850 | 06009 |
| Colusa County | Colusa | 21,836 | ±0% | 1,151 | $75,672 | 1850 | 06011 |
| Contra Costa County | Martinez | 1,170,070 | +0.4% | 717 | $127,229 | 1850 | 06013 |
| Del Norte County | Crescent City | 26,410 | −4.8% | 1,006 | $67,058 | 1857 | 06015 |
| El Dorado County | Placerville | 192,323 | +0.6% | 1,708 | $108,845 | 1850 | 06017 |
| Fresno County | Fresno | 1,035,456 | +2.7% | 5,959 | $74,201 | 1856 | 06019 |
| Glenn County | Willows | 28,141 | −2.7% | 1,314 | $67,139 | 1891 | 06021 |
| Humboldt County | Eureka | 131,647 | −3.5% | 3,568 | $61,160 | 1853 | 06023 |
| Imperial County | El Centro | 181,411 | +1% | 4,176 | $57,681 | 1907 | 06025 |
| Inyo County | Independence | 18,158 | −4.5% | 10,197 | $73,991 | 1866 | 06027 |
| Kern County | Bakersfield | 927,068 | +2% | 8,135 | $70,210 | 1866 | 06029 |
| Kings County | Hanford | 154,327 | +1.2% | 1,391 | $70,995 | 1893 | 06031 |
| Lake County | Lakeport | 67,772 | −0.6% | 1,255 | $60,621 | 1861 | 06033 |
| Lassen County | Susanville | 28,117 | −14.1% | 4,541 | $67,403 | 1864 | 06035 |
| Los Angeles County | Los Angeles | 9,694,934 | −3.2% | 4,060 | $90,112 | 1850 | 06037 |
| Madera County | Madera | 167,927 | +7.5% | 2,137 | $76,627 | 1893 | 06039 |
| Marin County | San Rafael | 253,694 | −3.3% | 520 | $149,091 | 1850 | 06041 |
| Mariposa County | Mariposa | 16,918 | −1.3% | 1,449 | $68,412 | 1850 | 06043 |
| Mendocino County | Ukiah | 88,122 | −3.8% | 3,507 | $68,092 | 1850 | 06045 |
| Merced County | Merced | 297,260 | +5.2% | 1,938 | $65,510 | 1855 | 06047 |
| Modoc County | Alturas | 8,426 | −3.2% | 3,948 | $59,455 | 1874 | 06049 |
| Mono County | Bridgeport | 12,505 | −5.3% | 3,049 | $99,415 | 1861 | 06051 |
| Monterey County | Salinas | 433,729 | −1.7% | 3,282 | $97,230 | 1850 | 06053 |
| Napa County | Napa | 132,949 | −3.7% | 752 | $111,471 | 1850 | 06055 |
| Nevada County | Nevada City | 101,911 | −0.3% | 958 | $89,882 | 1851 | 06057 |
| Orange County | Santa Ana | 3,149,507 | −1.2% | 793 | $116,289 | 1889 | 06059 |
| Placer County | Auburn | 442,081 | +9.2% | 1,407 | $115,998 | 1851 | 06061 |
| Plumas County | Quincy | 18,583 | −6.1% | 2,553 | $66,031 | 1854 | 06063 |
| Riverside County | Riverside | 2,544,916 | +5.2% | 7,209 | $93,074 | 1893 | 06065 |
| Sacramento County | Sacramento | 1,618,460 | +2.1% | 965 | $92,175 | 1850 | 06067 |
| San Benito County | Hollister | 70,082 | +9.2% | 1,389 | $114,394 | 1874 | 06069 |
| San Bernardino County | San Bernardino | 2,224,091 | +2% | 20,068 | $85,478 | 1853 | 06071 |
| San Diego County | San Diego | 3,282,248 | −0.5% | 4,211 | $106,268 | 1850 | 06073 |
| San Francisco County | San Francisco | 826,079 | −6% | 47 | $140,970 | 1850 | 06075 |
| San Joaquin County | Stockton | 823,815 | +5.7% | 1,392 | $92,179 | 1850 | 06077 |
| San Luis Obispo County | San Luis Obispo | 282,367 | −0% | 3,301 | $97,446 | 1850 | 06079 |
| San Mateo County | Redwood City | 743,568 | −2.7% | 449 | $158,855 | 1856 | 06081 |
| Santa Barbara County | Santa Barbara | 442,065 | −1.4% | 2,734 | $98,161 | 1850 | 06083 |
| Santa Clara County | San Jose | 1,914,391 | −1.1% | 1,291 | $164,281 | 1850 | 06085 |
| Santa Cruz County | Santa Cruz | 258,852 | −4.9% | 445 | $111,093 | 1850 | 06087 |
| Shasta County | Redding | 181,648 | −0.4% | 3,776 | $72,636 | 1850 | 06089 |
| Sierra County | Downieville | 3,098 | −4.2% | 953 | $63,355 | 1852 | 06091 |
| Siskiyou County | Yreka | 42,013 | −4.7% | 6,279 | $59,095 | 1852 | 06093 |
| Solano County | Fairfield | 455,376 | +0.4% | 822 | $100,401 | 1850 | 06095 |
| Sonoma County | Santa Rosa | 486,444 | −0.5% | 1,575 | $104,674 | 1850 | 06097 |
| Stanislaus County | Modesto | 557,719 | +0.8% | 1,496 | $81,468 | 1854 | 06099 |
| Sutter County | Yuba City | 98,787 | −0.9% | 603 | $79,704 | 1850 | 06101 |
| Tehama County | Red Bluff | 64,665 | −1.9% | 2,949 | $63,784 | 1856 | 06103 |
| Trinity County | Weaverville | 15,720 | −2.5% | 3,179 | $53,002 | 1850 | 06105 |
| Tulare County | Visalia | 485,146 | +2.5% | 4,824 | $71,300 | 1852 | 06107 |
| Tuolumne County | Sonora | 53,160 | −4.4% | 2,221 | $77,404 | 1850 | 06109 |
| Ventura County | Ventura | 830,851 | −1.6% | 1,841 | $109,797 | 1873 | 06111 |
| Yolo County | Woodland | 224,410 | +3% | 1,013 | $91,752 | 1850 | 06113 |
| Yuba County | Marysville | 88,691 | +8.7% | 632 | $76,373 | 1850 | 06115 |
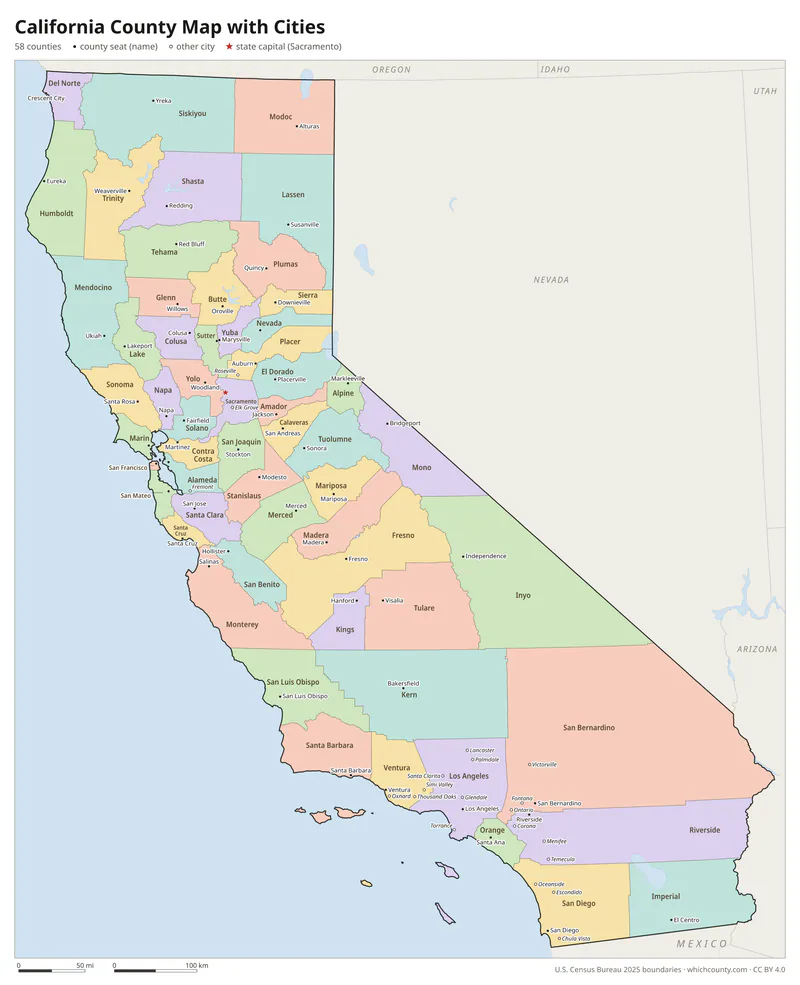
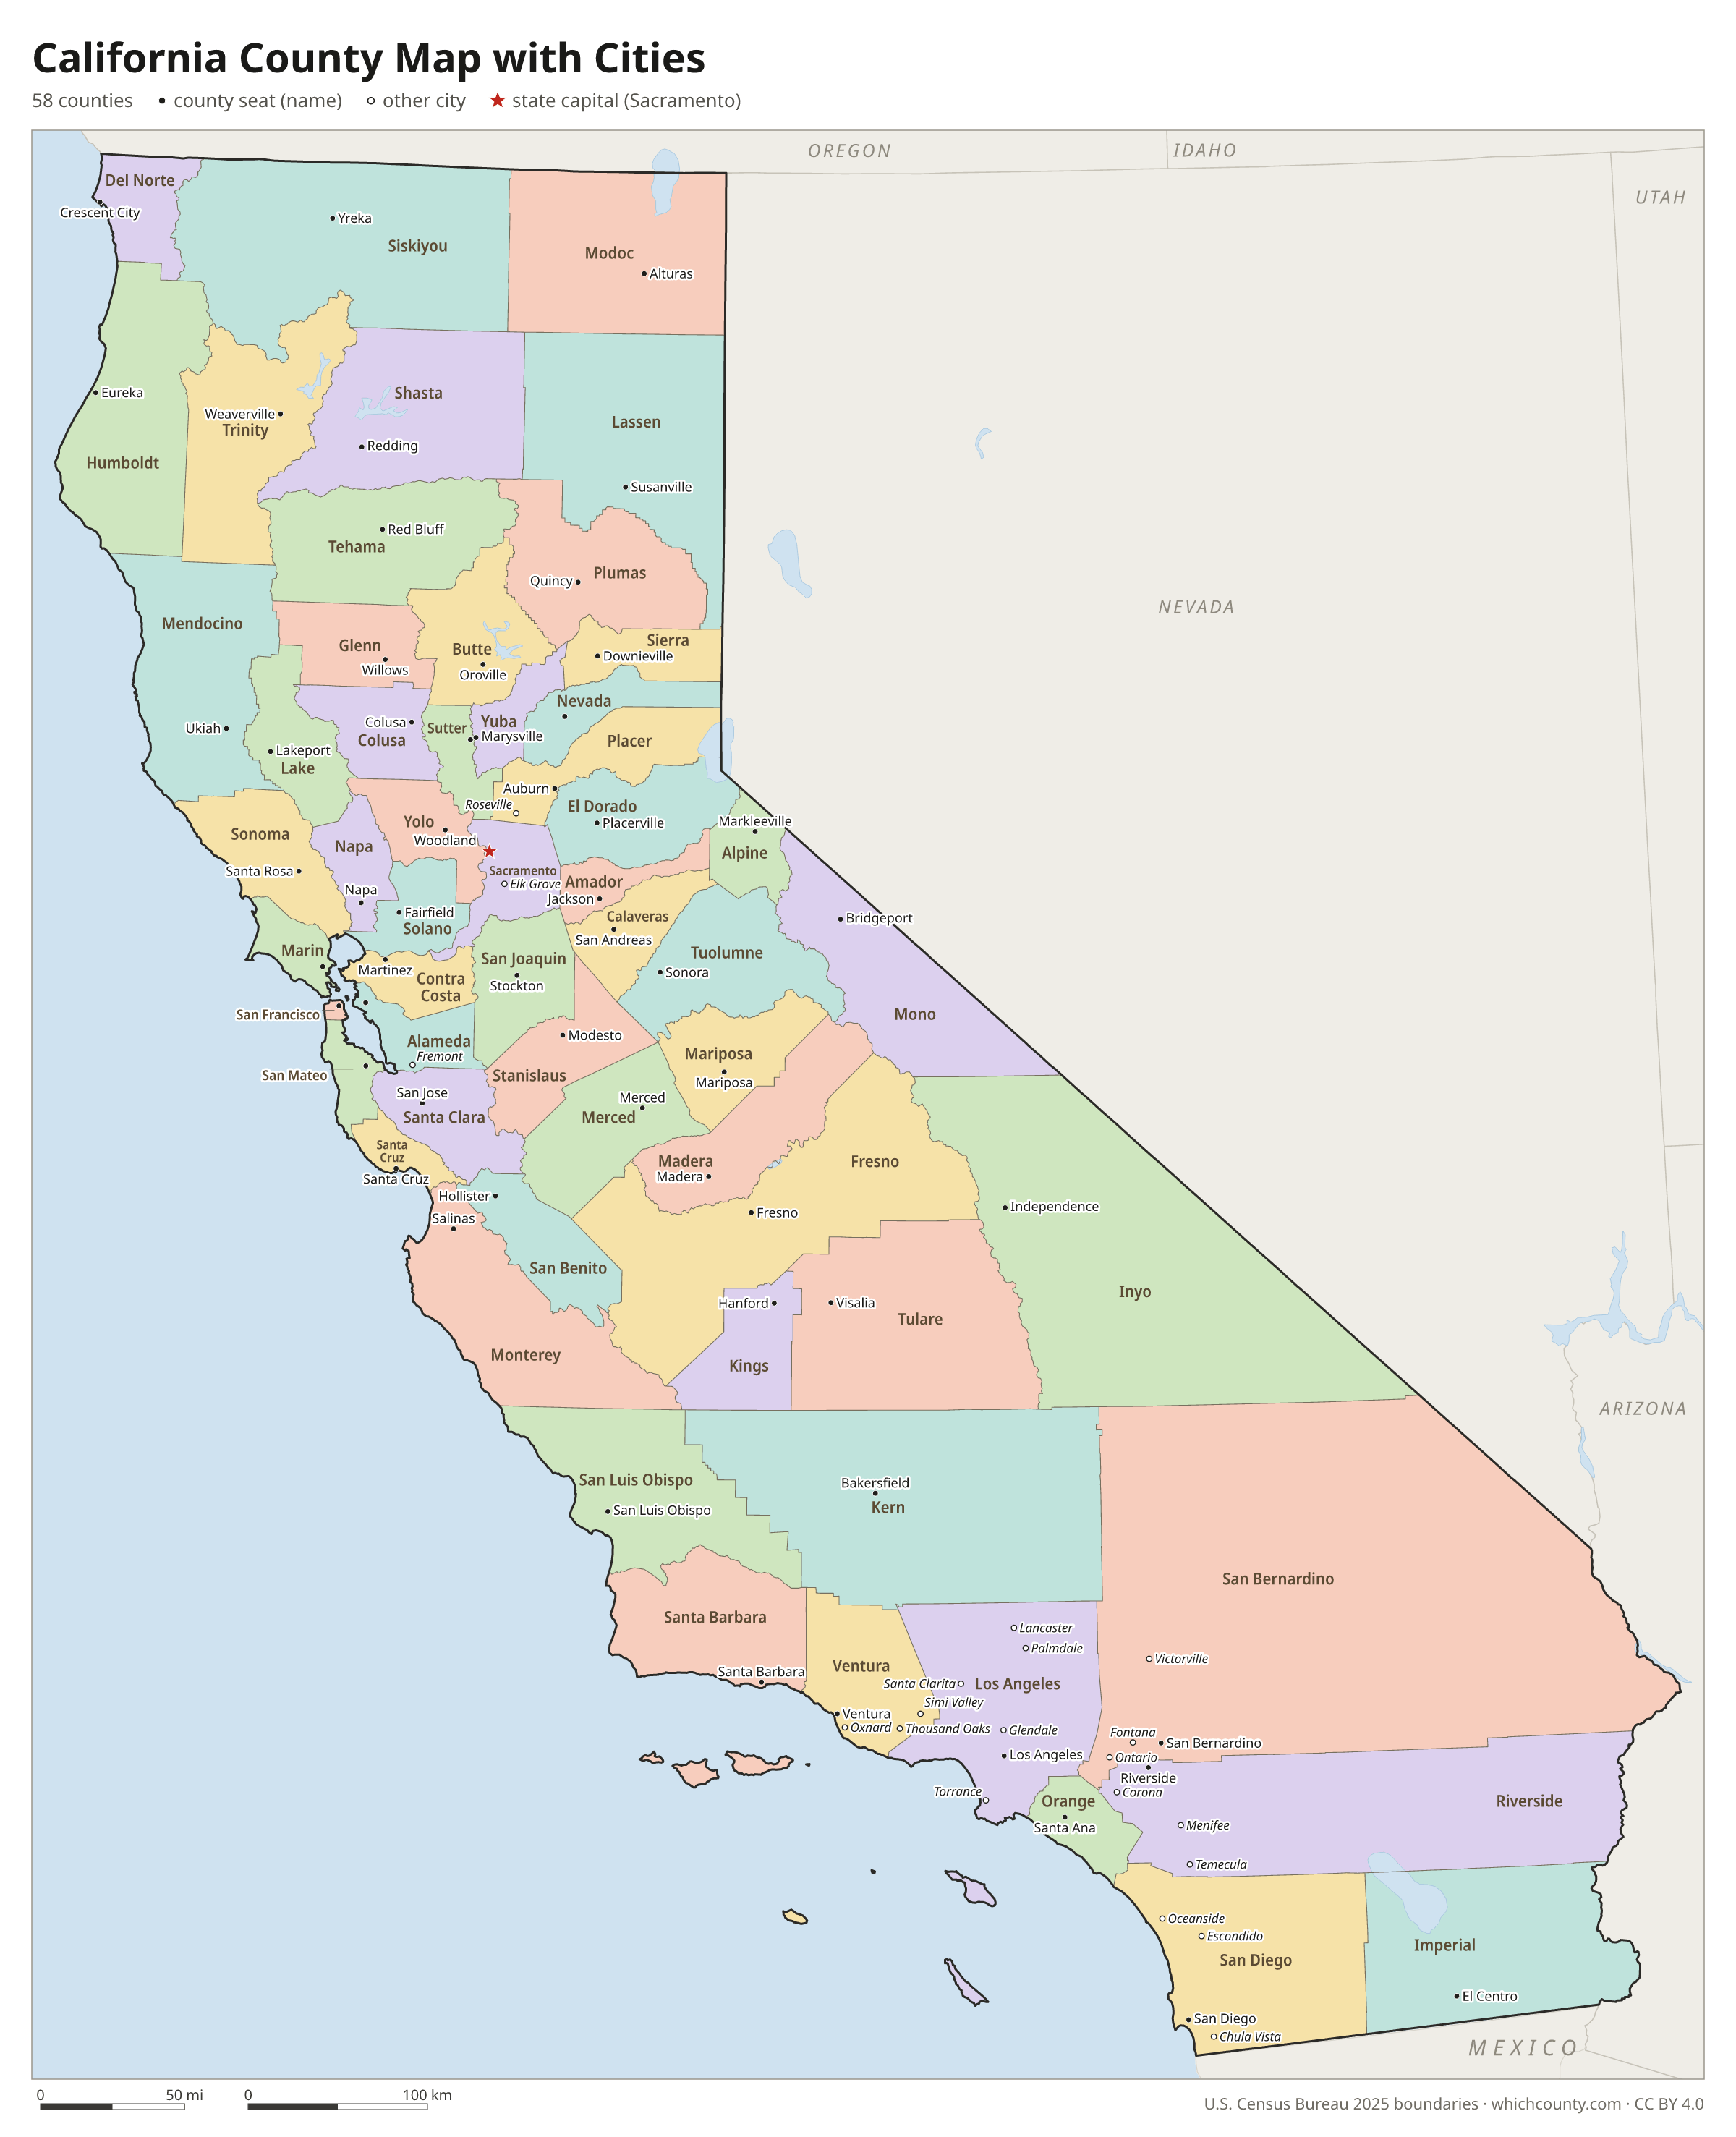
California county map with cities
The largest cities in California and the counties they are in. Cities that cross a county line list every county, the main one first. To find any smaller town, use the search box above.
| City | County | Population 2025 |
|---|---|---|
| Los Angeles | Los Angeles County | 3,869,089 |
| San Diego | San Diego County | 1,406,106 |
| San Jose | Santa Clara County | 989,814 |
| San Francisco | San Francisco County | 826,079 |
| Fresno | Fresno County | 555,549 |
| Sacramento | Sacramento County | 536,449 |
| Long Beach | Los Angeles County | 450,469 |
| Oakland | Alameda County | 440,838 |
| Bakersfield | Kern County | 422,165 |
| Anaheim | Orange County | 341,008 |
| Stockton | San Joaquin County | 324,597 |
| Riverside | Riverside County | 323,057 |
| Irvine | Orange County | 318,764 |
| Santa Ana | Orange County | 315,586 |
| Chula Vista | San Diego County | 275,533 |
| Santa Clarita | Los Angeles County | 228,430 |
| Fremont | Alameda County | 226,442 |
| San Bernardino | San Bernardino County | 222,044 |
| Fontana | San Bernardino County | 221,223 |
| Modesto | Stanislaus County | 219,652 |
| Moreno Valley | Riverside County | 214,263 |
| Oxnard | Ventura County | 199,651 |
| Huntington Beach | Orange County | 191,451 |
| Glendale | Los Angeles County | 187,160 |
| Ontario | San Bernardino County | 187,013 |
| Elk Grove | Sacramento County | 185,007 |
| Santa Rosa | Sonoma County | 179,437 |
| Rancho Cucamonga | San Bernardino County | 177,856 |
| Oceanside | San Diego County | 170,483 |
| Garden Grove | Orange County | 170,455 |
Printable California county maps (free PDF, PNG, SVG)
Every map is free to print and share. The PDFs are vector files with real text, so they stay sharp at any size and you can search them for a county name. Use 11×17 (tabloid) for the most readable labels.
Color map with names
All 58 counties labeled, county seats marked. Letter and 11×17 PDF, high-resolution PNG, editable SVG.
Map with cities
Counties with their county seat towns and major cities.
Blank outline map
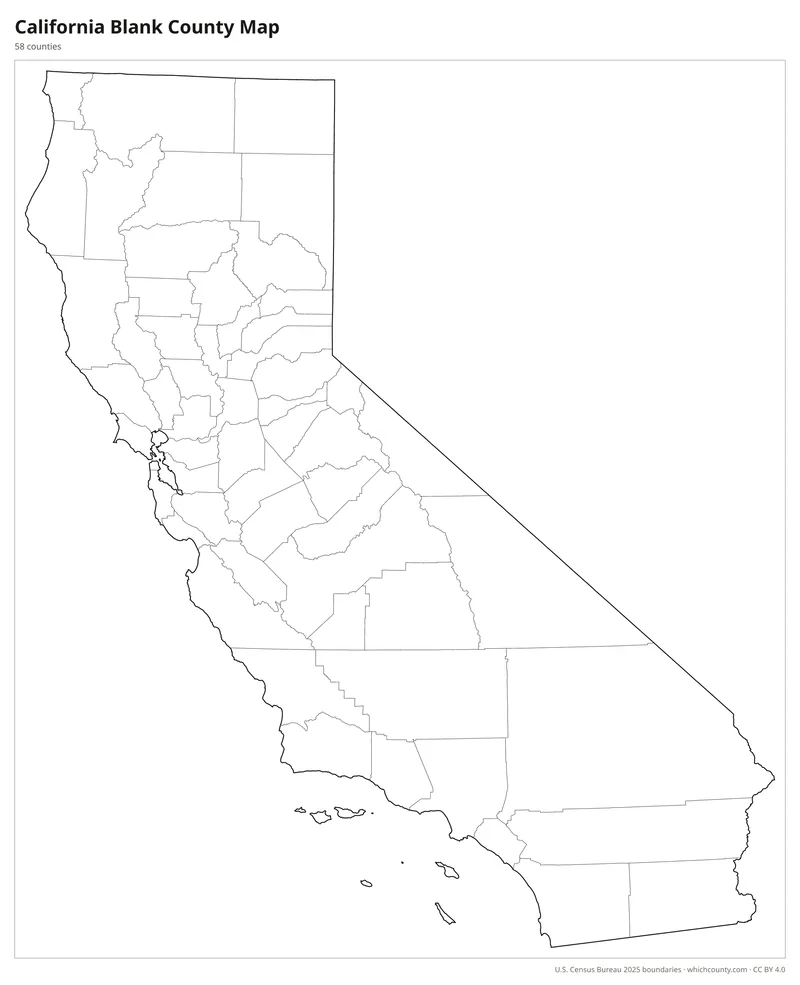
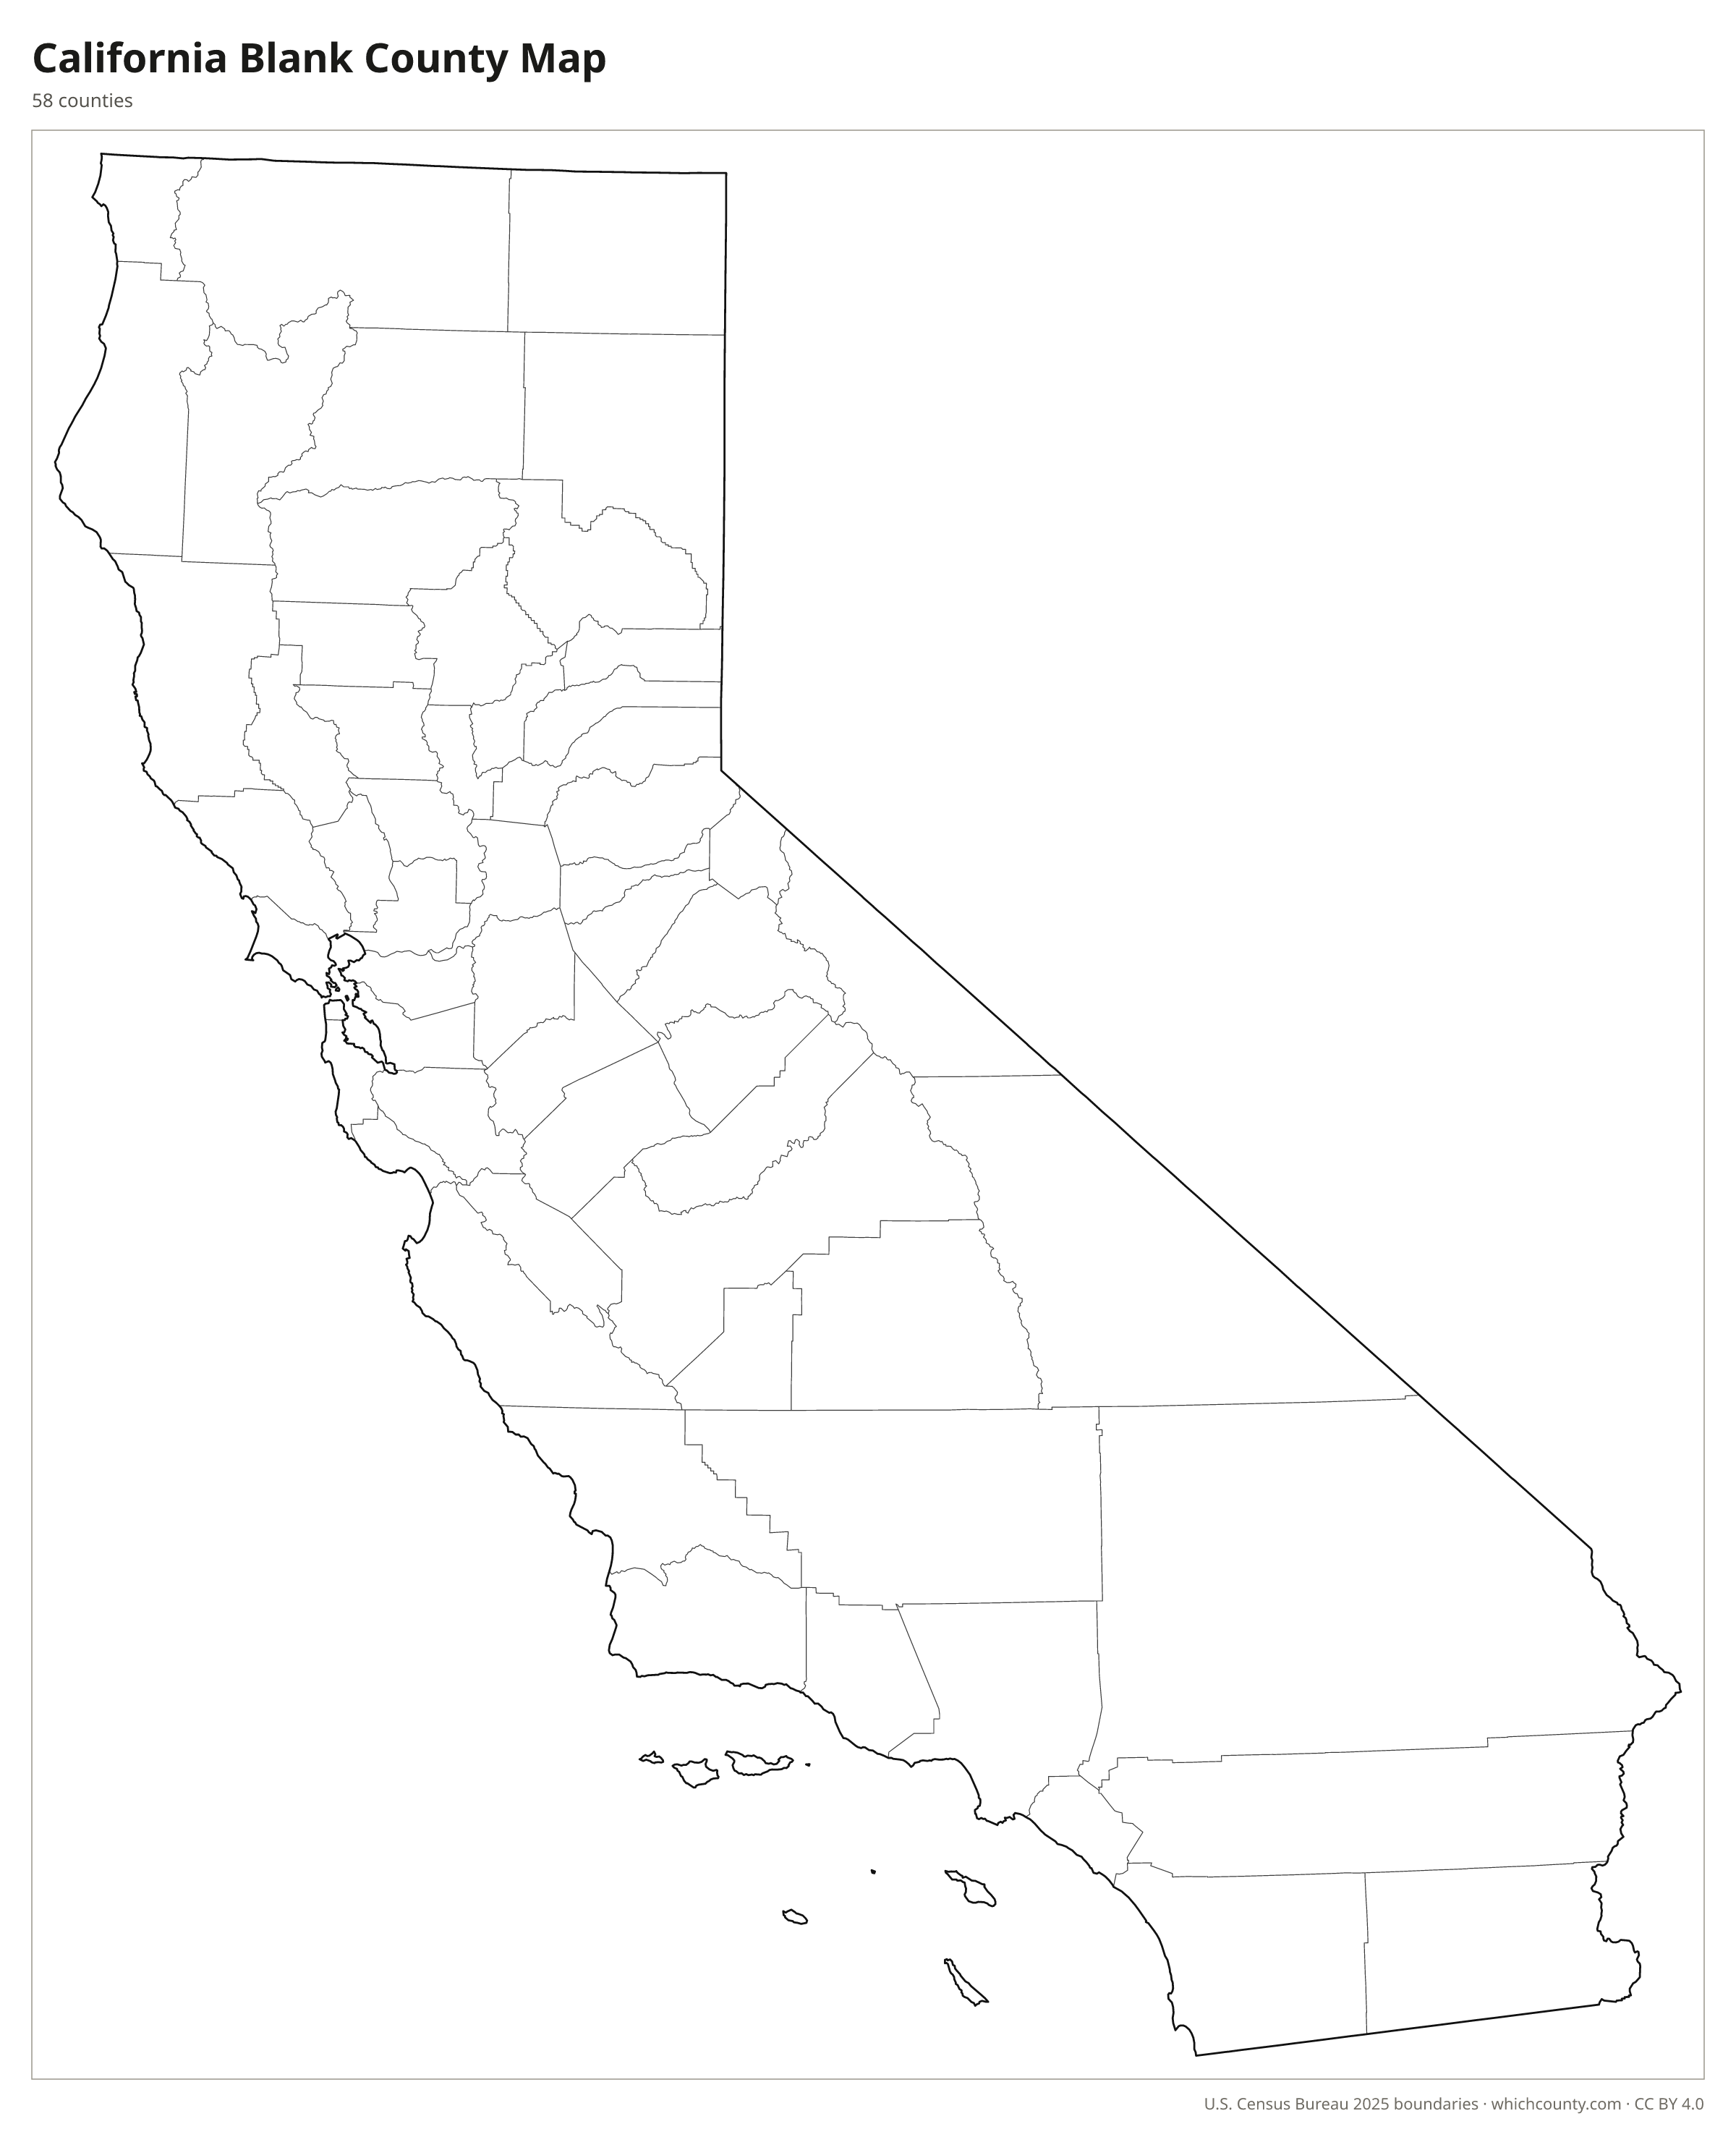
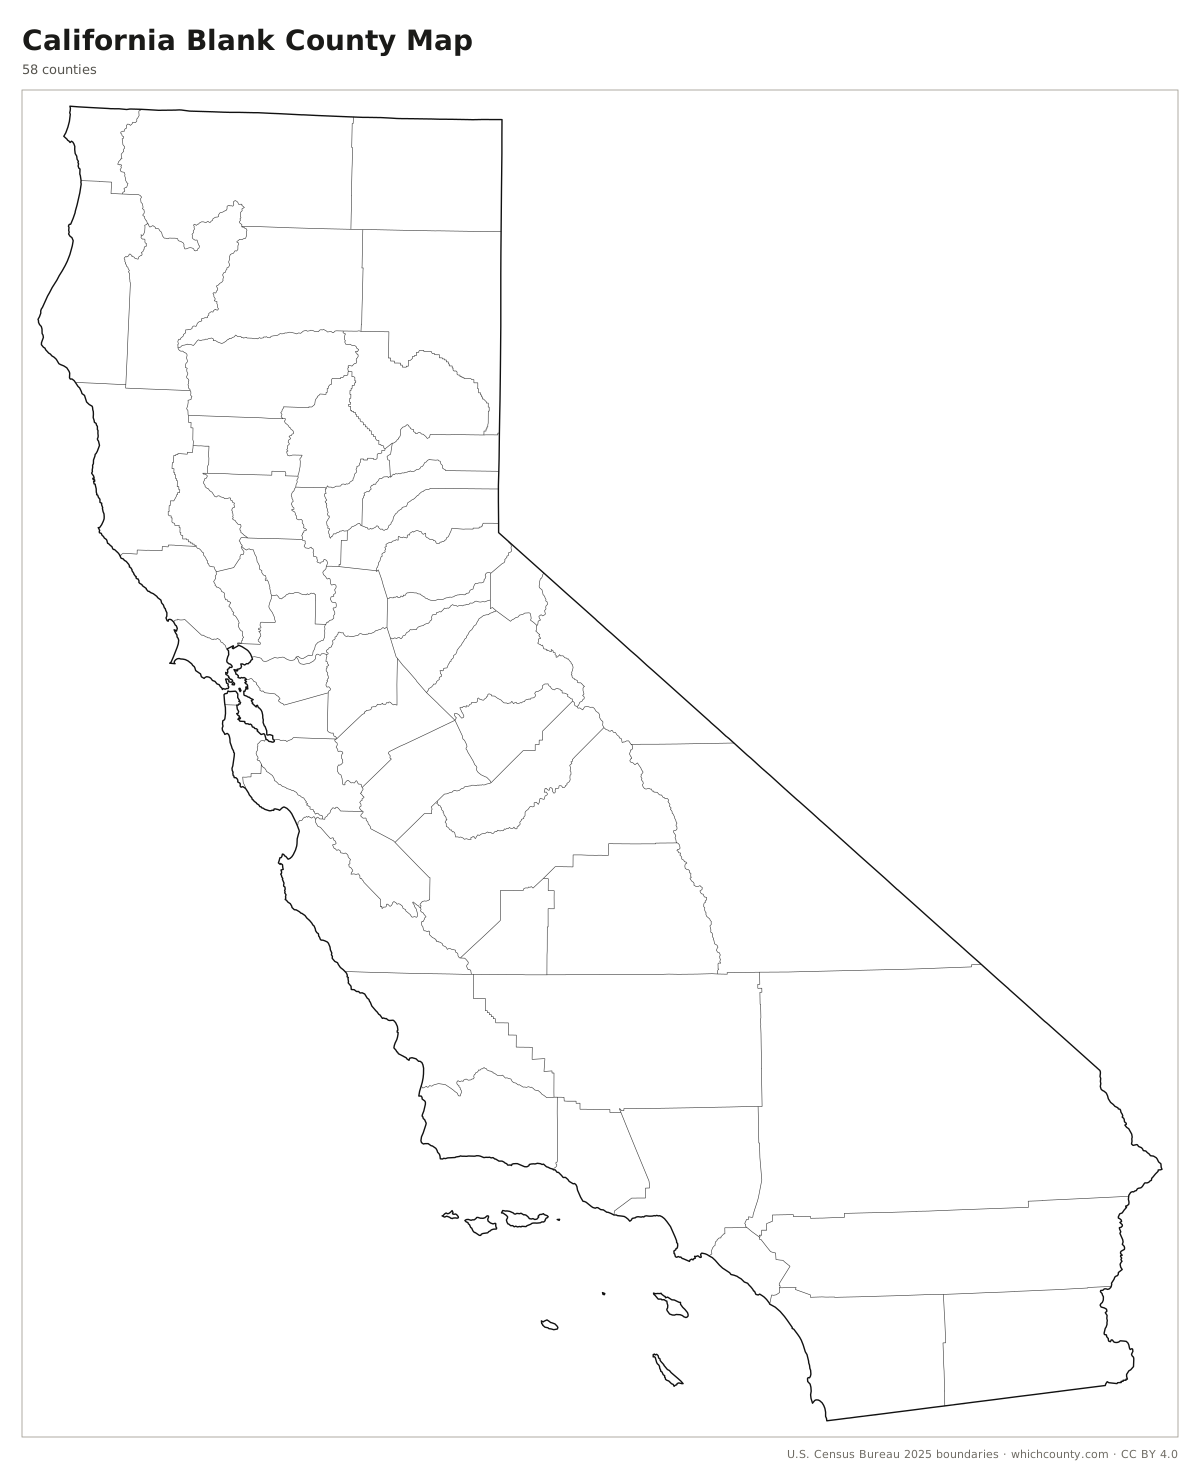
County lines only, no names. For quizzes, coloring and your own notes.
Numbered map with key
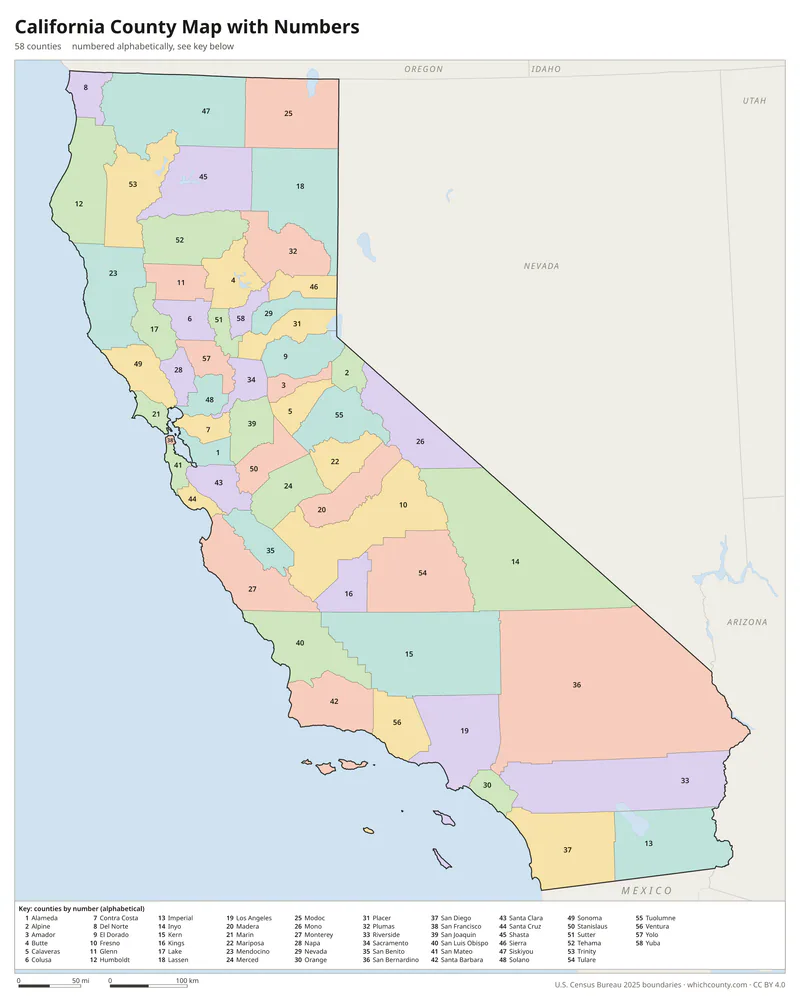
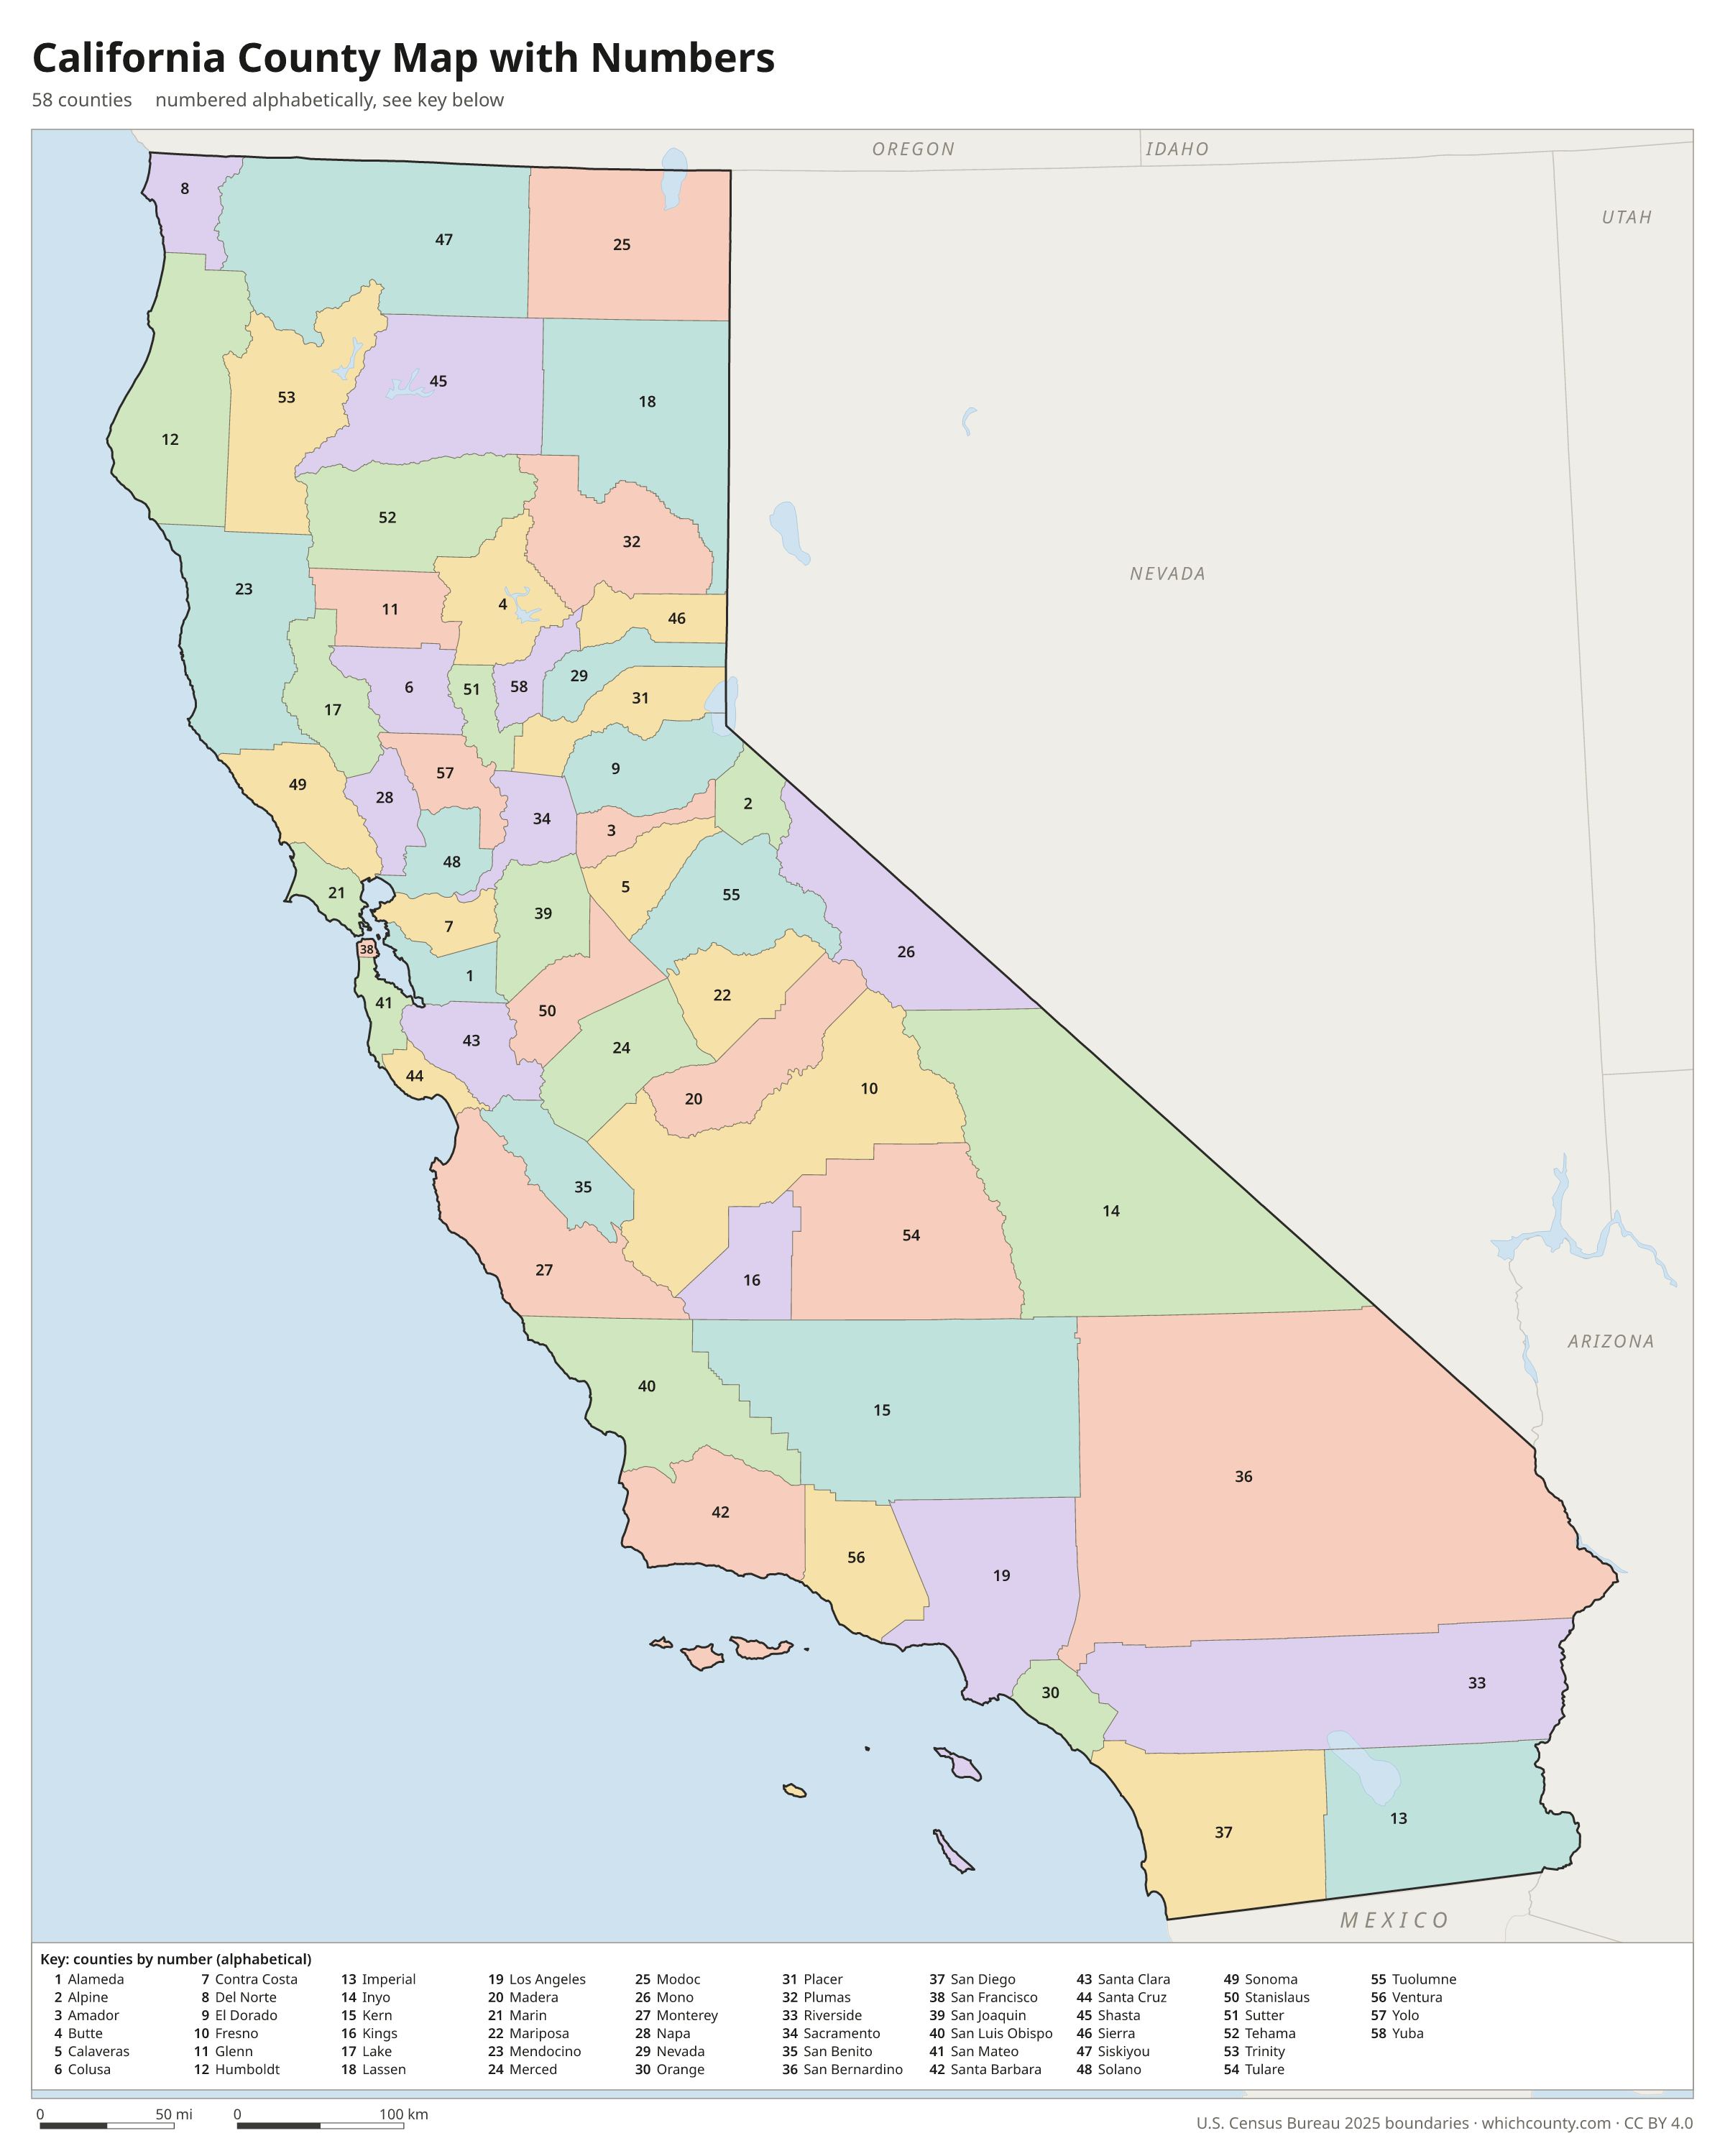
A number in every county with an alphabetical key.
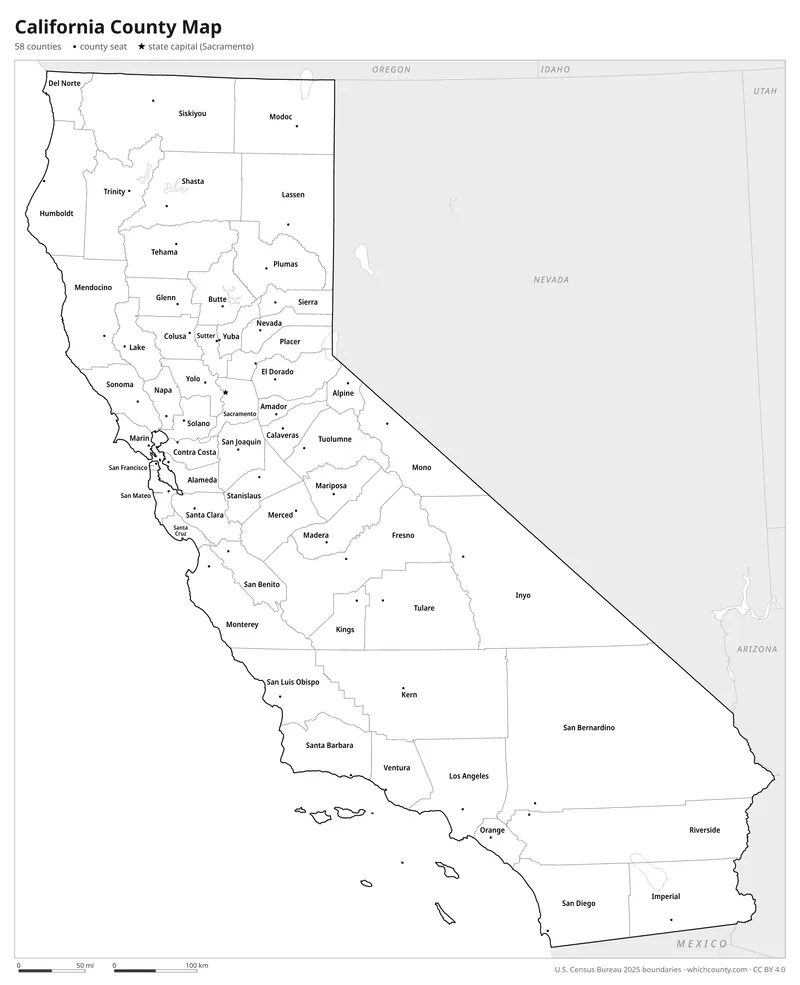
Black and white
Labeled map that prints well on any printer.
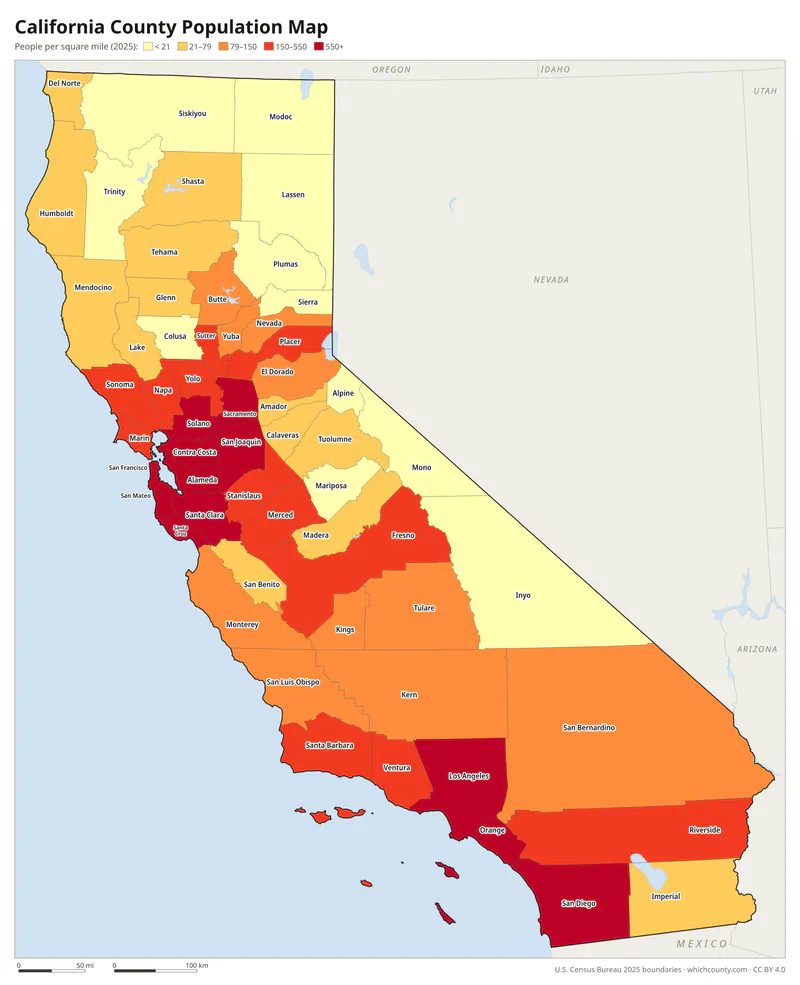
Population map
Counties shaded by population density (2025 estimates).
Data and GIS files
The county table as CSV, and the boundaries as GeoJSON and KML (Google Earth, Google My Maps).
How California got its 58 counties
California was divided into counties before it became a state. The first Legislature's Senate Committee on County Boundaries proposed 18 counties, but many areas objected to the counties drawn for them and wanted their own. On February 18, 1850, the Legislature passed a bill creating 27 counties instead, among them Los Angeles, San Diego, San Francisco and Sacramento. Sixteen more were created before 1860, and the rest were split from existing counties over the next five decades. Imperial County, separated from San Diego County in 1907, was the last. The state constitution now requires a majority vote of the electors in each affected county before a new county can be formed or two counties consolidated.
County maps of neighboring states
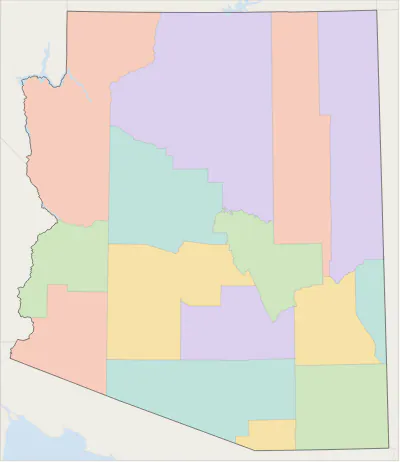 Arizona county map
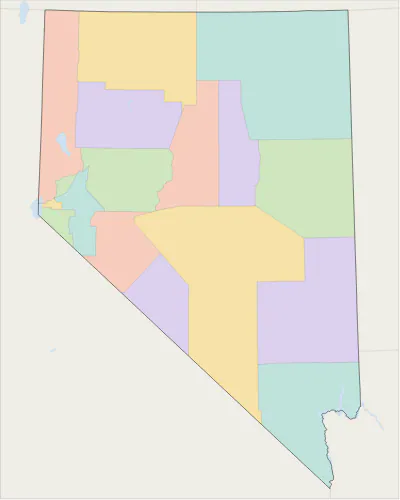 Nevada county map
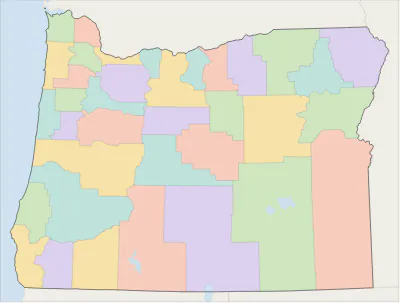 Oregon county map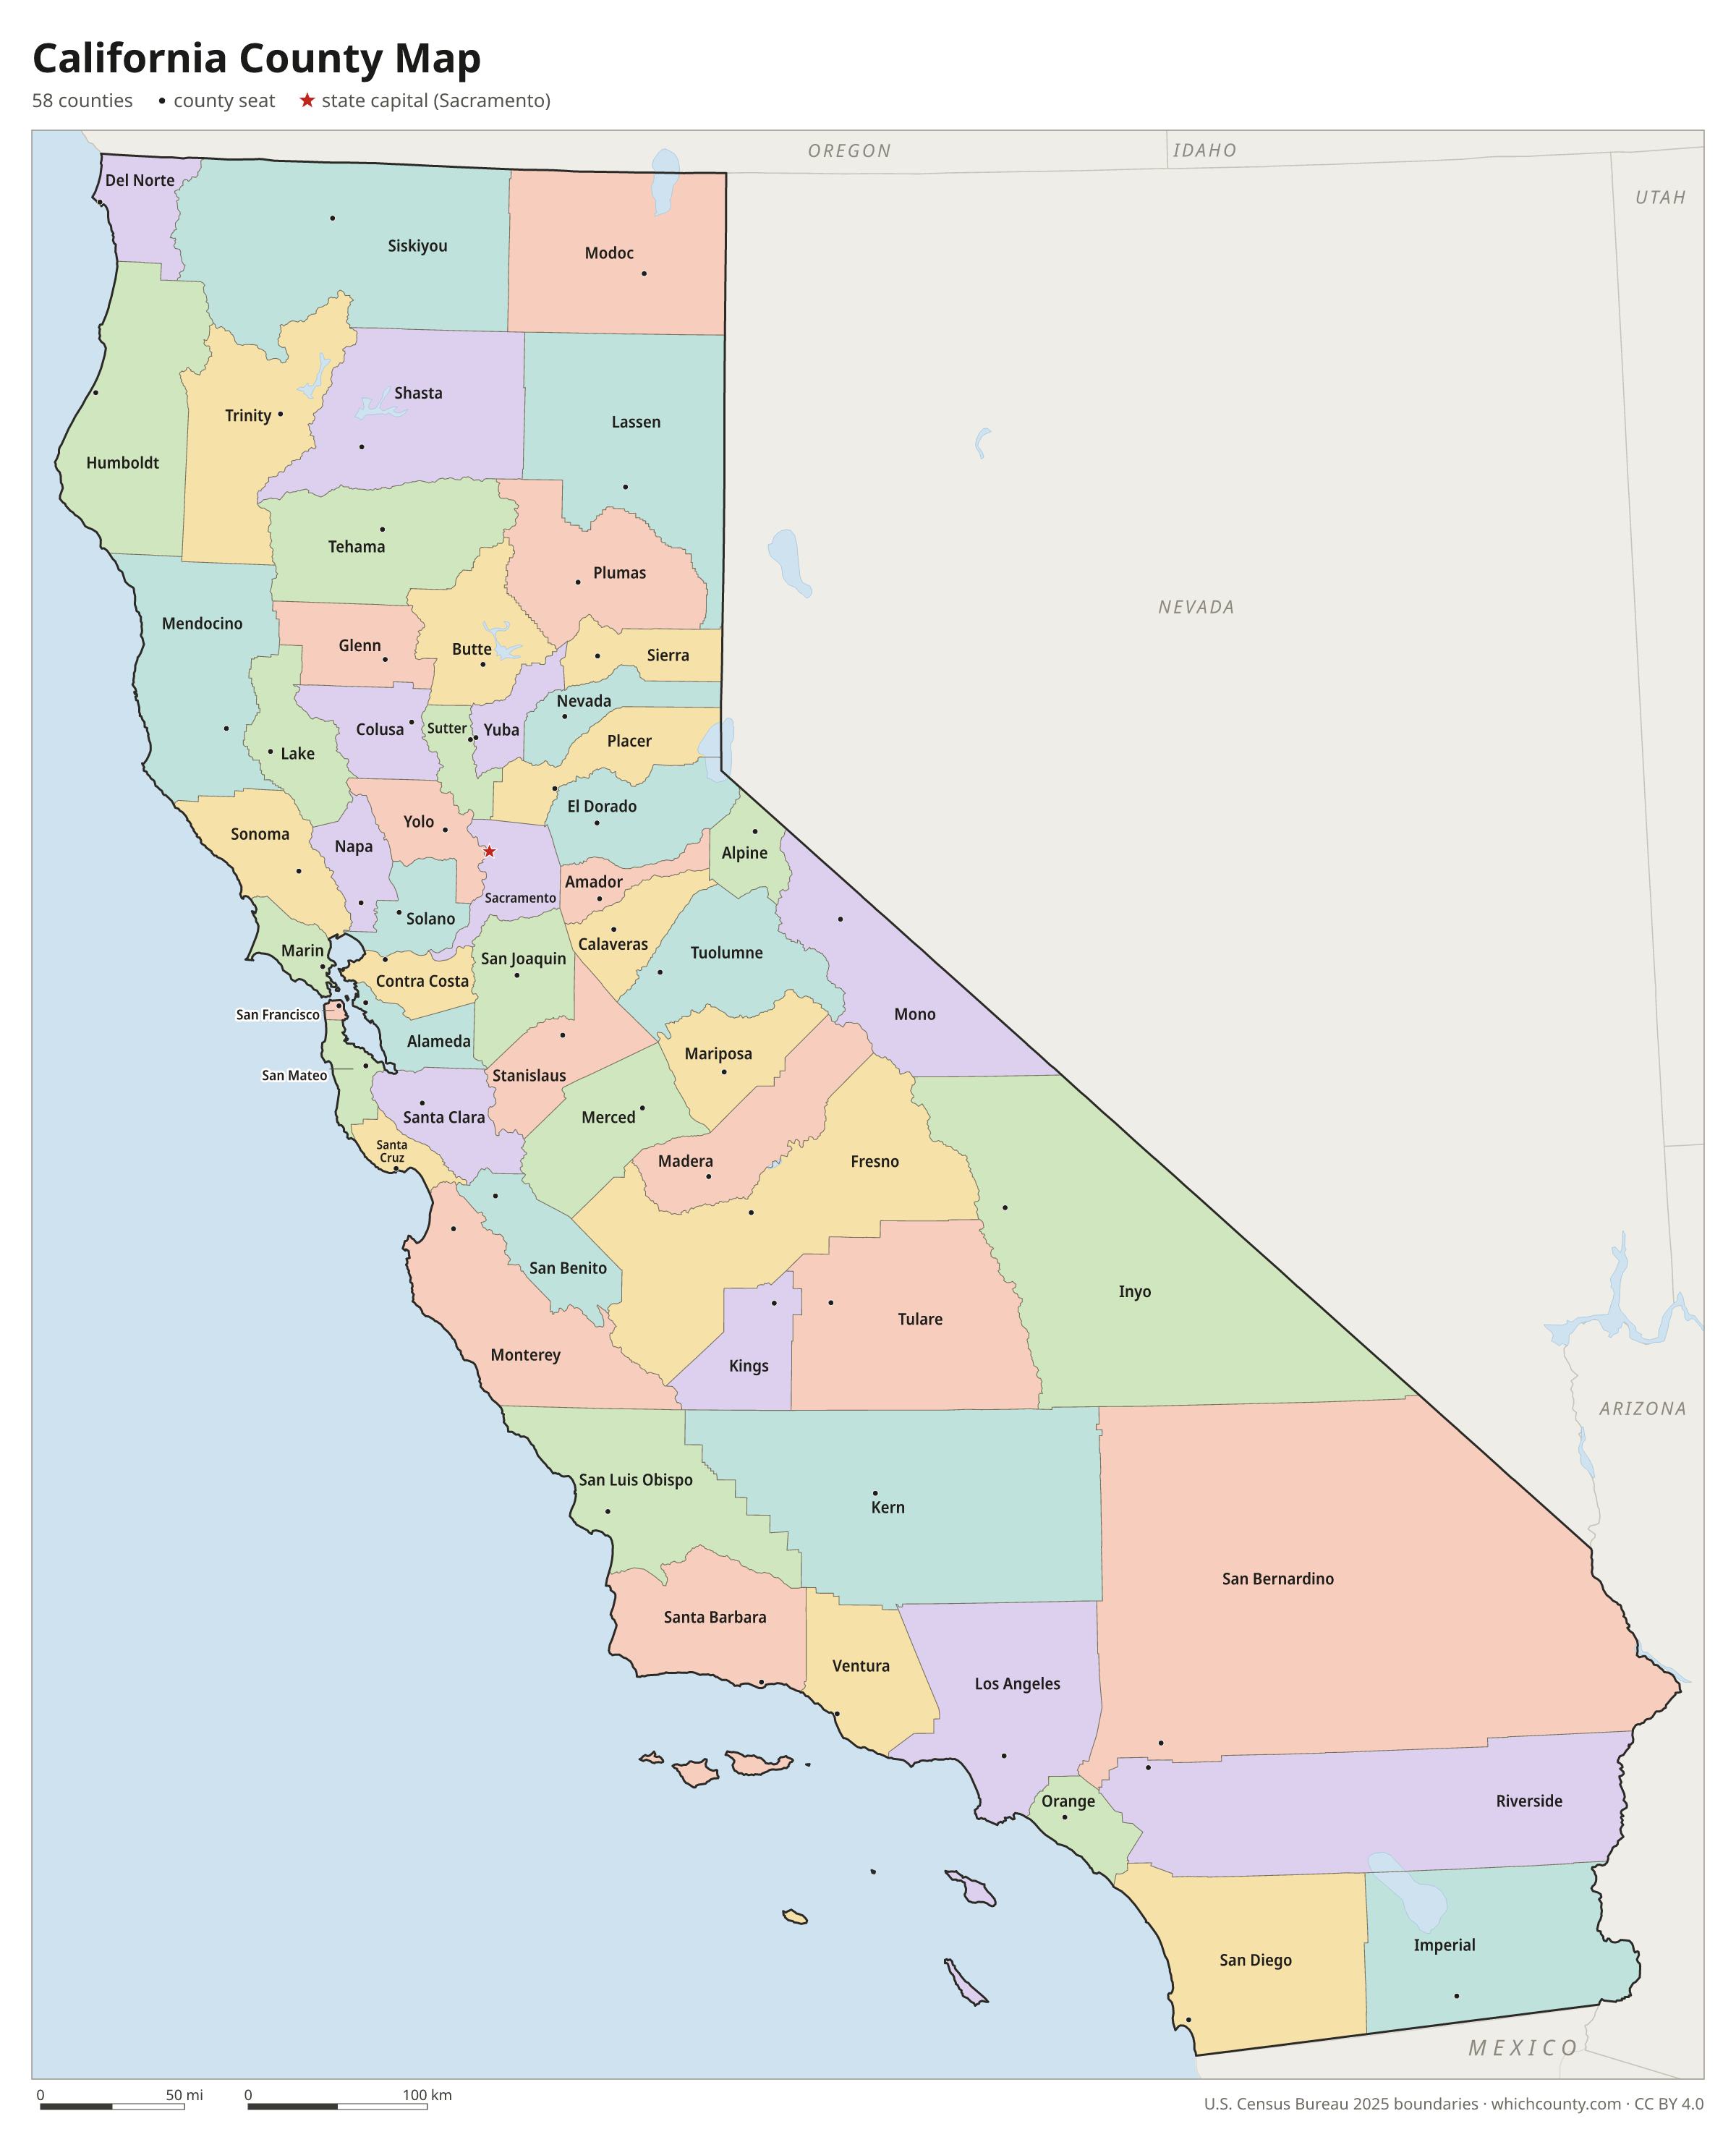
California counties: questions and answers
- How many counties are in California?
- California has 58 counties.
- What is the largest county in California?
- By land area, San Bernardino County is the largest (20,068 sq mi). By population, Los Angeles County is the largest, with 9,694,934 people (2025 estimate).
- What is the smallest county in California?
- San Francisco County is the smallest by land area (46.7 sq mi). Alpine County has the fewest people: 1,043 (2025 estimate).
- What is the wealthiest county in California?
- By median household income, Santa Clara County ranks first with $164,281 (American Community Survey 2020–2024). The lowest is Trinity County at $53,002.
- What county is Los Angeles in?
- Los Angeles is in Los Angeles County.
- What county is San Diego in?
- San Diego is in San Diego County.
- What county is San Jose in?
- San Jose is in Santa Clara County.
- What county is Sacramento in?
- Sacramento, the state capital, is in Sacramento County.
- How can I see county lines on Google Maps?
- Google Maps does not draw county lines. Download the KML file from the printable maps section above and import it into Google My Maps (Create a new map › Import) or open it in Google Earth to see every California county boundary on top of Google's map.
- Can I use this map for free?
- Yes. The maps and files on this page are free to print, share and use in your own work, including commercial projects, under the CC BY 4.0 licence. Please credit “WhichCounty (whichcounty.com)”.
Use this map on your site
You may copy, print and publish these maps, also commercially, as long as you credit WhichCounty with a link (licence details). Paste this code to embed the map:
Sources and methodology
- Boundaries: U.S. Census Bureau, 2025 Cartographic Boundary Files (1:500,000), simplified for display. Projection: Lambert conformal conic fitted to California.
- Population: Census Bureau county estimates, Vintage 2025 (July 1, 2025), compared with the April 1, 2020 estimates base.
- Land area: Census Bureau 2026 Gazetteer files. Median household income: American Community Survey 2020–2024 5-year estimates.
- County seats and founding years: Wikidata (CC0), checked against state lists by WhichCounty. Cities: Census Bureau city and town estimates, Vintage 2025.
- California's Legislature, Chapter VI: Legislative Sessions (California State Assembly, 2016 ed.)
- County Fact Sheet (California Senate Governance and Finance Committee, 2016)
- California Constitution, Article XI: Local Government
- Atlas of Historical County Boundaries: California (Newberry Library)
Found an error? Tell us. Last data update: October 4, 2026.