El Paso County, Texas
County seat: El Paso · Population 877,858 (2025) · 1,014 sq mi
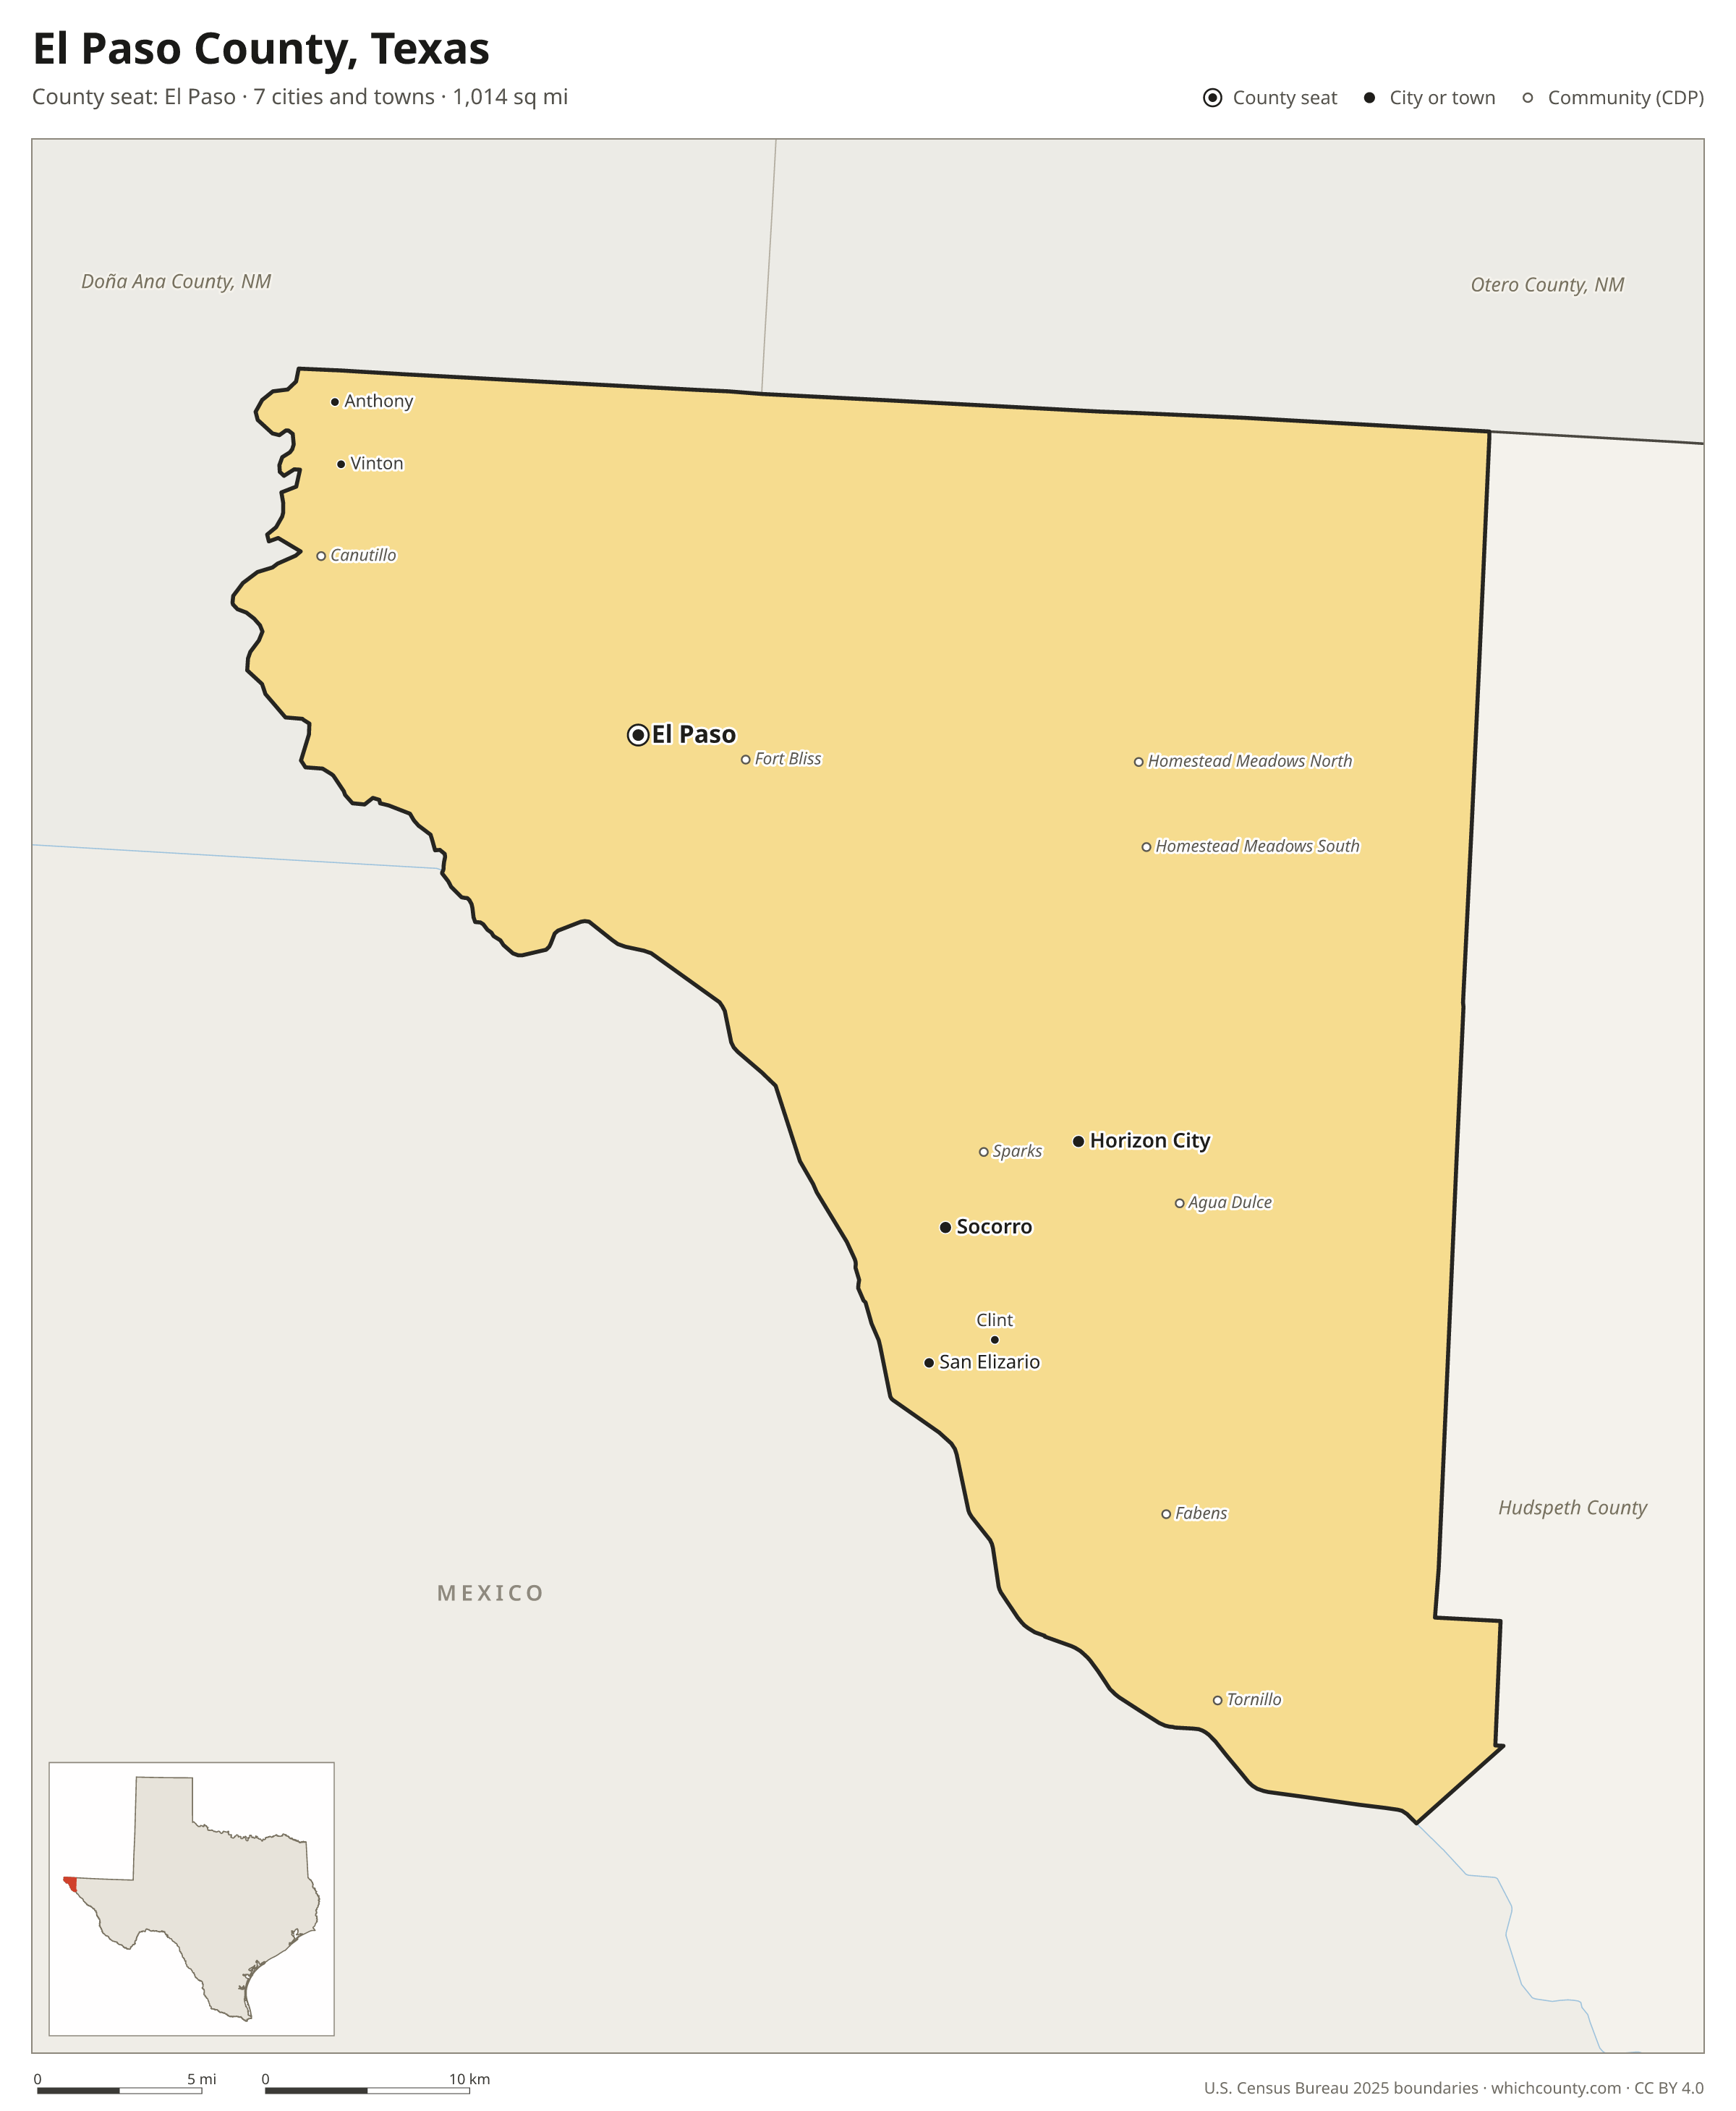
El Paso County is the 10th most populous of Texas's 254 counties, with 877,858 people (2025 estimate). Its county seat is El Paso. It is part of the Upper Rio Grande region, one of the 12 Texas Comptroller economic regions. The map shows its 7 cities and towns and the 3 neighboring counties.

El Paso County facts
- County seat
- El Paso
- Population (2025 estimate)
- 877,858 +1.4% since 2020
- Land area
- 1,014 sq mi 70th largest of 254
- Water area
- 2 sq mi
- Population density
- 866 per sq mi
- Established
- 1850
- Named after
- El Paso city in and county seat of El Paso County, Texas, United States
- Largest city
- El Paso 683,012
- Median household income
- $59,806
- Cities and towns
- 7 plus 12 CDPs
- ZIP codes
- 31
- Time zone
- Mountain
- FIPS code
- 48141
Cities and towns in El Paso County
El Paso County has 7 incorporated cities, towns and villages. Populations count the people living inside El Paso County; cities that cross a county line also list the other counties.
| Name | Type | Population 2025 | Also in |
|---|---|---|---|
| El Paso (county seat) | City | 683,012 | |
| Socorro | City | 38,787 | |
| Horizon City | City | 25,118 | |
| San Elizario | City | 10,138 | |
| Anthony | Town | 4,539 | |
| Vinton | Village | 2,446 | |
| Clint | Town | 1,060 |
Unincorporated communities (CDPs)
Census-designated places are communities without their own city government; the county provides their services.
| Community | Population | Also in |
|---|---|---|
| Fort Bliss | 11,460 | |
| Homestead Meadows South | 6,660 | |
| Canutillo | 5,962 | |
| Homestead Meadows North | 5,795 | |
| Fabens | 4,818 | |
| Sparks | 4,134 | |
| Westway | 3,484 | |
| Agua Dulce | 2,697 | |
| Tornillo | 1,341 | |
| Prado Verde | 474 | |
| Morning Glory | 431 | |
| Butterfield | 71 |
ZIP codes in El Paso County
31 ZIP codes reach into El Paso County. ZIP codes ignore county lines, so some also cover a neighboring county.
- 79821
- 79835
- 79836
- 79838
- 79849
- 79853
- 79901
- 79902
- 79903
- 79904
- 79905
- 79906
- 79907
- 79908
- 79911
- 79912
- 79915
- 79916
- 79918
- 79920
- 79922
- 79924
- 79925
- 79927
- 79928
- 79930
- 79932
- 79934
- 79935
- 79936
- 79938 also Hudspeth County
Population of El Paso County, 2020–2025
El Paso County grew by 12,143 people (+1.4%) between April 2020 and July 2025: 20,251 more births than deaths and a net loss of 8,783 people from migration.
| Year (July 1) | Population |
|---|---|
| 2020 | 866,582 |
| 2021 | 867,558 |
| 2022 | 868,332 |
| 2023 | 873,242 |
| 2024 | 879,894 |
| 2025 | 877,858 |
Neighboring counties
- Hudspeth County southeast · 3,433 people
- Doña Ana County, New Mexico northwest · 229,091 people
- Otero County, New Mexico northeast · 70,368 people
Printable El Paso County map
The PDF is a vector file with real text: it prints sharp on Letter paper and you can search it for a town. The PNG is 2400 pixels wide for slides and documents. Both are free to use with a credit to WhichCounty.
- PDF (Letter) (158 KB)
- PNG (2400 px) (88 KB)
Paste this code to embed the map on your site:
Sources
- Boundaries: U.S. Census Bureau, 2025 Cartographic Boundary Files (1:500,000).
- Population: Census Bureau county and city estimates, Vintage 2025. CDP populations: American Community Survey 2020–2024.
- Places and ZIP codes: Census Bureau 2026 Gazetteer and 2020 ZIP Code Tabulation Area relationship files.
- County seat, founding year and name origin: Wikidata (CC0), checked against state sources.
Back to the Texas county map with all 254 counties. Found an error? Tell us.