South Central Connecticut Planning Region, Connecticut
Population 578,741 (2025) · 367 sq mi
South Central Connecticut Planning Region is the 3rd most populous of Connecticut's 9 planning regions, with 578,741 people (2025 estimate). The map shows its 5 cities and towns and the 5 neighboring counties.

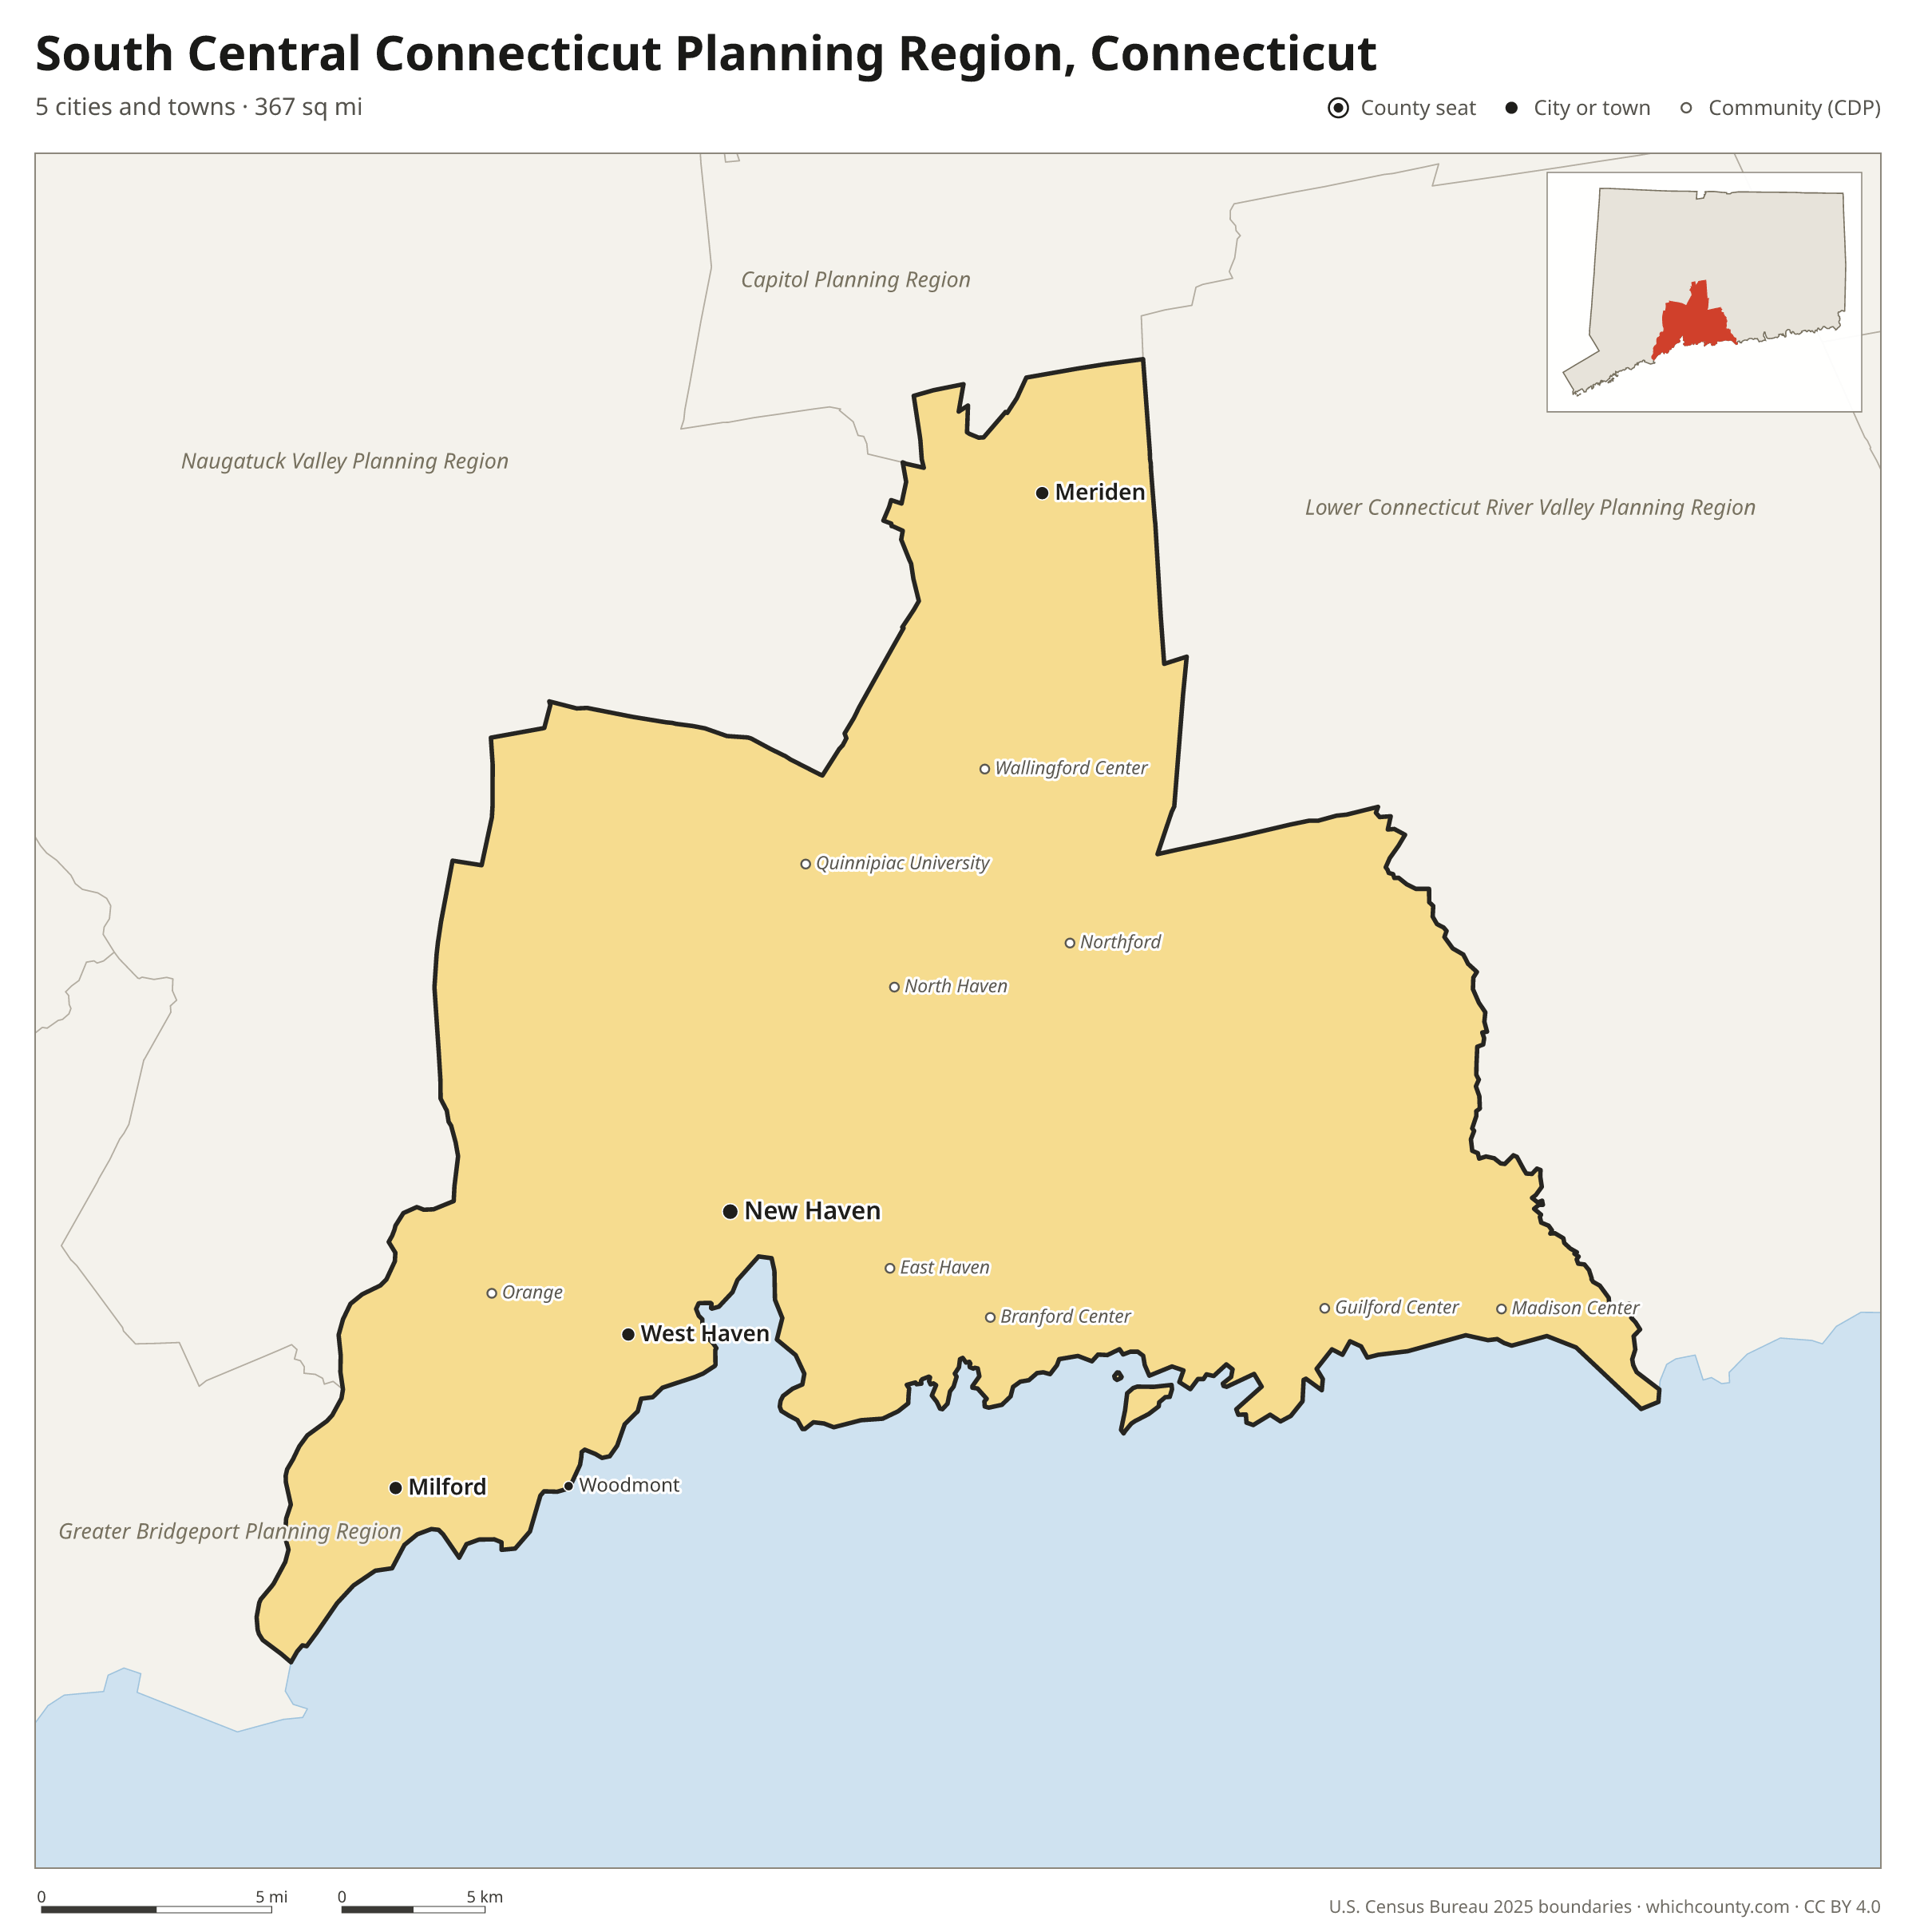
South Central Connecticut Planning Region facts
- Population (2025 estimate)
- 578,741 +1.4% since 2020
- Land area
- 367 sq mi 8th largest of 9
- Water area
- 252 sq mi
- Population density
- 1,576 per sq mi
- Largest city
- New Haven 138,774
- Median household income
- $88,197
- Cities and towns
- 5 plus 9 CDPs
- ZIP codes
- 24
- Time zone
- Eastern
- FIPS code
- 09170
Cities and towns in South Central Connecticut Planning Region
South Central Connecticut Planning Region has 5 incorporated cities, towns and villages. Populations count the people living inside South Central Connecticut Planning Region; cities that cross a county line also list the other counties.
| Name | Type | Population 2025 | Also in |
|---|---|---|---|
| New Haven | City | 138,774 | |
| Meriden | City | 60,810 | |
| West Haven | City | 55,351 | |
| Milford | City | 51,215 | |
| Woodmont | Borough | 2,391 |
Unincorporated communities (CDPs)
Census-designated places are communities without their own city government; the county provides their services.
| Community | Population | Also in |
|---|---|---|
| East Haven | 27,806 | |
| North Haven | 24,336 | |
| Wallingford Center | 18,208 | |
| Orange | 14,315 | |
| Branford Center | 6,305 | |
| Northford | 6,186 | |
| Quinnipiac University | 4,311 | |
| Guilford Center | 2,263 | |
| Madison Center | 1,981 |
ZIP codes in South Central Connecticut Planning Region
24 ZIP codes reach into South Central Connecticut Planning Region. ZIP codes ignore county lines, so some also cover a neighboring county.
- 06405
- 06437
- 06443
- 06450
- 06451 also Capitol Planning Region
- 06460
- 06461
- 06471
- 06472
- 06473
- 06477
- 06492 also Naugatuck Valley Planning Region
- 06510
- 06511
- 06512
- 06513
- 06514
- 06515
- 06516
- 06517
- 06518
- 06519
- 06524
- 06525
Population of South Central Connecticut Planning Region, 2020–2025
South Central Connecticut Planning Region grew by 7,995 people (+1.4%) between April 2020 and July 2025: 901 more deaths than births and a net gain of 10,078 people from migration.
| Year (July 1) | Population |
|---|---|
| 2020 | 564,449 |
| 2021 | 569,020 |
| 2022 | 569,606 |
| 2023 | 572,366 |
| 2024 | 577,538 |
| 2025 | 578,741 |
Neighboring counties
- Lower Connecticut River Valley Planning Region northeast · 177,311 people
- Naugatuck Valley Planning Region northwest · 463,349 people
- Suffolk County, New York south · 1,546,090 people
- Greater Bridgeport Planning Region west · 337,697 people
- Capitol Planning Region north · 994,115 people
Printable South Central Connecticut Planning Region map
The PDF is a vector file with real text: it prints sharp on Letter paper and you can search it for a town. The PNG is 2400 pixels wide for slides and documents. Both are free to use with a credit to WhichCounty.
- PDF (Letter) (128 KB)
- PNG (2400 px) (111 KB)
Paste this code to embed the map on your site:
Cite this map
- APA
- WhichCounty. (2026, October 4). South Central Connecticut Planning Region, Connecticut Map [Map]. https://whichcounty.com/connecticut/south-central-connecticut-planning-region/
- MLA
- “South Central Connecticut Planning Region, Connecticut Map.” WhichCounty, 4 Oct. 2026, whichcounty.com/connecticut/south-central-connecticut-planning-region/.
- Chicago
- WhichCounty. “South Central Connecticut Planning Region, Connecticut Map.” Last modified October 4, 2026. https://whichcounty.com/connecticut/south-central-connecticut-planning-region/.
Sources
- Boundaries: U.S. Census Bureau, 2025 Cartographic Boundary Files (1:500,000).
- Population: Census Bureau county and city estimates, Vintage 2025. CDP populations: American Community Survey 2020–2024.
- Places and ZIP codes: Census Bureau 2026 Gazetteer and 2020 ZIP Code Tabulation Area relationship files.
- County seat, founding year and name origin: Wikidata (CC0), checked against state sources.
Back to the Connecticut county map with all 9 planning regions. Found an error? Tell us.